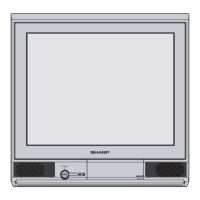
21S-FX10L
5 – 7
SCREEN, WHITE BALANCE, SUB-BRIGHTNESS & SUB-CONTRAST ADJUSTMENT(2)
NO
ADJUSTMENT POINT
ADJUSTMENT CONDITION / PROCEDURE
WAVEFORM OR OTHERS
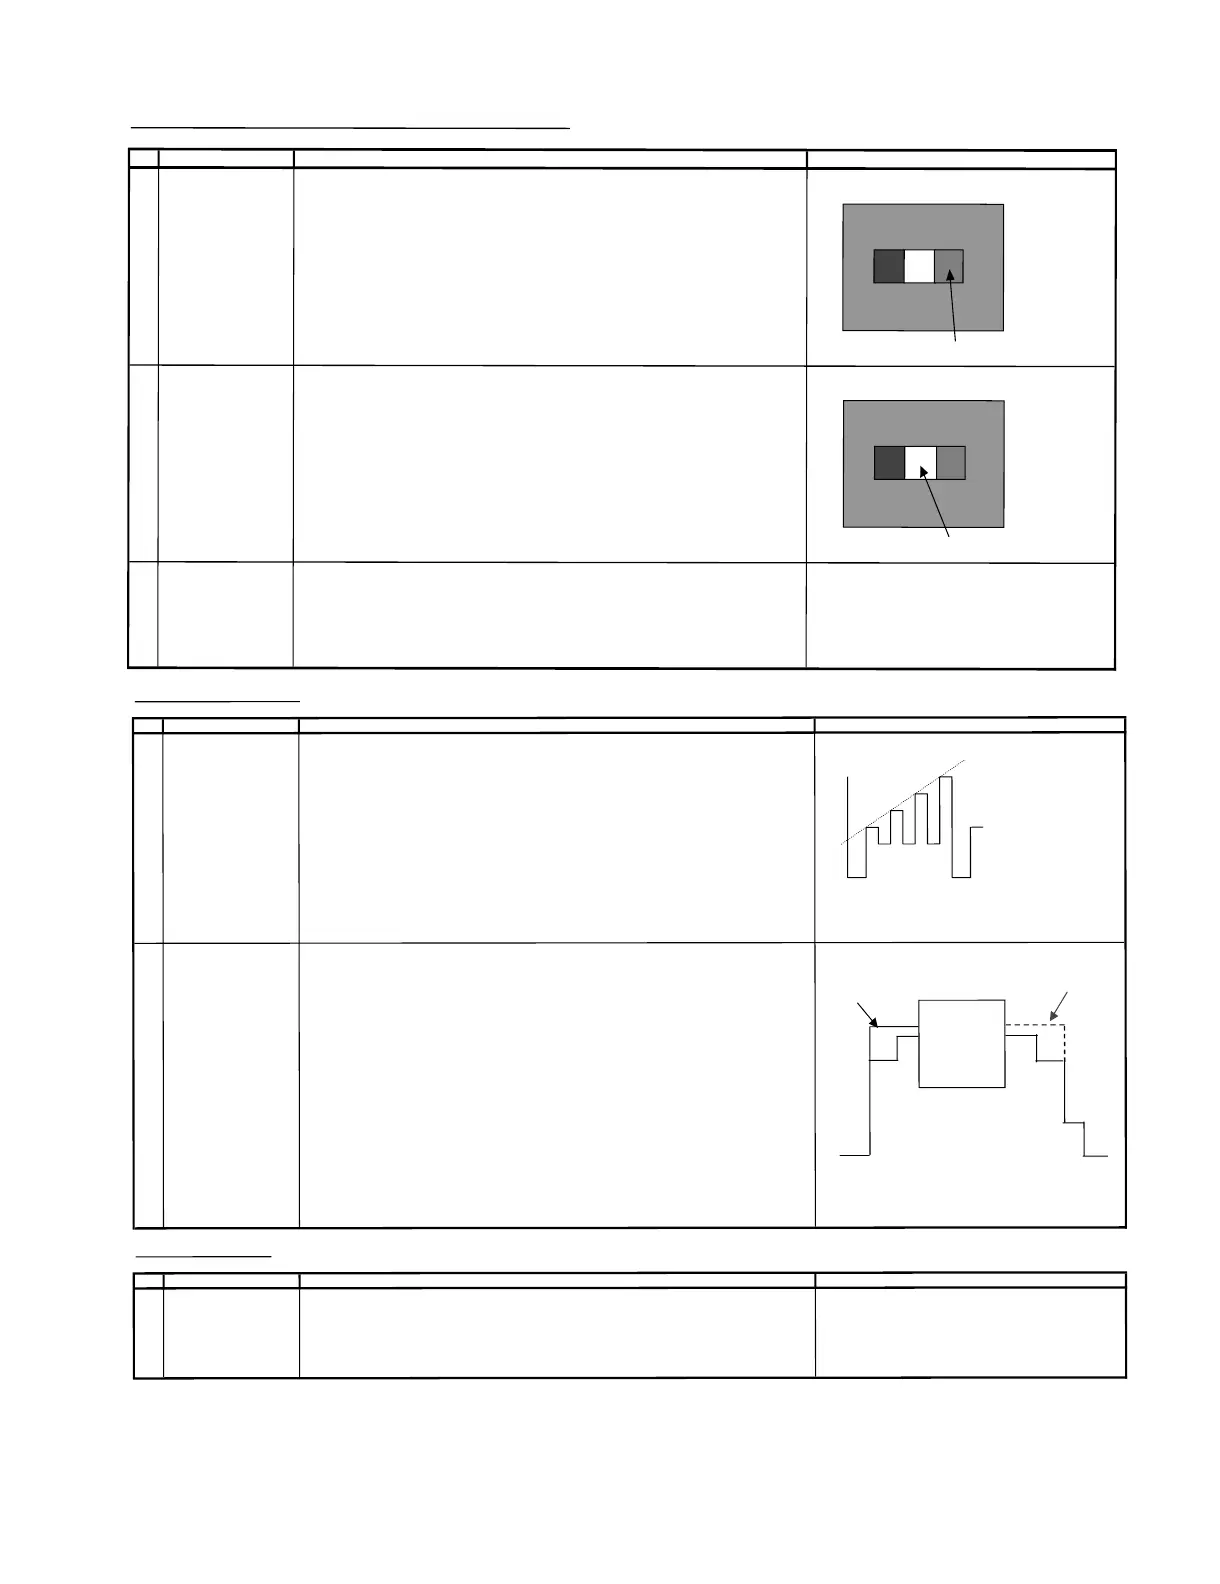
3 SUB-BRIGHTNESS (1) In CH 23 50IRE window pattern signal condition.
(to be done after screen, (2) Using Minolta Color Analyzer CA-100, let the gun point at
Dark White position
white balance adj) (as attach drawing), adjust V04 Bus data until
BRIGHTNESS Y
= 1.5cd/m2
(I2C BUS CONTROL)
4
SUB-CONTRAST (1) In CH 23 50IRE window pat
tern sign
al condition.
(to be done after screen,
(2) Using Minolta Color Analyzer CA-100, let the gun point at
W
hite
po
s
ition
white balance adj, (as attach drawing), adjust V01 Bus data until BRIGHTNESS Y
= 150cd/m2
sub-brightness adj)
(I2C BUS CONTROL)
** NOTE: Allowable Data for V01 >=90, even Y can't match the spec
White
5 BEAM CURRENT CHECK (1) Receive US 4 CH LION HEAD Signal (NTSC 60 Hz).
(2)
Press R/C to set Picture NORMAL condition.
(3) Connect the DC miliammeter between TP 603 ( +)&TP602(-)
(Full Scale: 3m
A Range).
(4) Beam current must be within :
1000 ± 100μA
US14
Dark White
US14
NTSC CHROMA ADJUSTMENT
NO ADJUSTMENT POIN
ADJUSTMENT CONDITION / PROCEDUR
WAVEFORM OR REMARK
1 SUB-TINT
(1) Receive the "US 10 CH HALF Color Bar" signal.
(2) Connect the oscilloscope to JA410 or TP853 B
LUE-OUT
(I2C BUS CONTROL)
R
ange : 500mV/Div (AC) (Use Probe 10:1)
Sweep time : 10μsec/Div
(3) Select the servicedata V02 . On Y-mute using the R/C.
(4) Adjust the V02 (Sub tint) data to obtain the waveform as shown in Figure 1.
1
(B-Amp Bas
e (TP853) must be in stepping level)
*REMARK : PLEASE MAKE SUR
E
USE RF SIGNAL DURING SUB TINT ADJUSTMENT
Fig 1-1
2S
UB COLOR (1) R
eceive the "US 10 CH HALF Color
B
a
r" signal.
(2)
Make the image normal
with the remote controlle
r.
(I2C BUS CON
TROL) (3) Connec
t the oscilloscope to JA401 (TP851) RED-OUT.
(to be done after
sub tint adj) R
ange : 500mV/Div (AC) ( Use Probe 10:1)
Sweep time : 10μsec/Div
(4) Select the service data V03. Adjust the
V03 (Sub color) data to obt
ain the waveform
adjustment showninFig. 1-2.
(5) Fig 1.2 waveforms shows that the 75% white & red portions of color bar at the sa
me level
*REMARK
: PLEASE
MAKE SURE USE R
F SIGNAL DURING SUB COLO
UR ADJUSTMENT
Fig 1-2
M
S LEVEL ADJUSTMEN
T
NO ADJ
USTMENT PO
IN
ADJUSTMENT C
O
NDITION / PROCEDUR
WAVEFORM OR REMARK
1
MS LEVEL (1) R
e
ceive the "US 10 CH HALF Color Bar" signal.
ADJUS
TMENT
(2)
C
onnect the oscillosc
ope to IC3003
pin 17 ( C3014 -VE).
(I2C BUS CONTRO
L) (3) Se
t
the sound
volume c
ontrol
more than 1.
(4) Adjust the bus data
M01
unti
l
t
he voltage of IC3003 pin 17 (C3014 -VE) become as follows:
530m (+
18m,-35m) Vr
m
s
W
Y
Cy
G
100% WHITE
Mg
R
B