SM-SX100
– 14 –
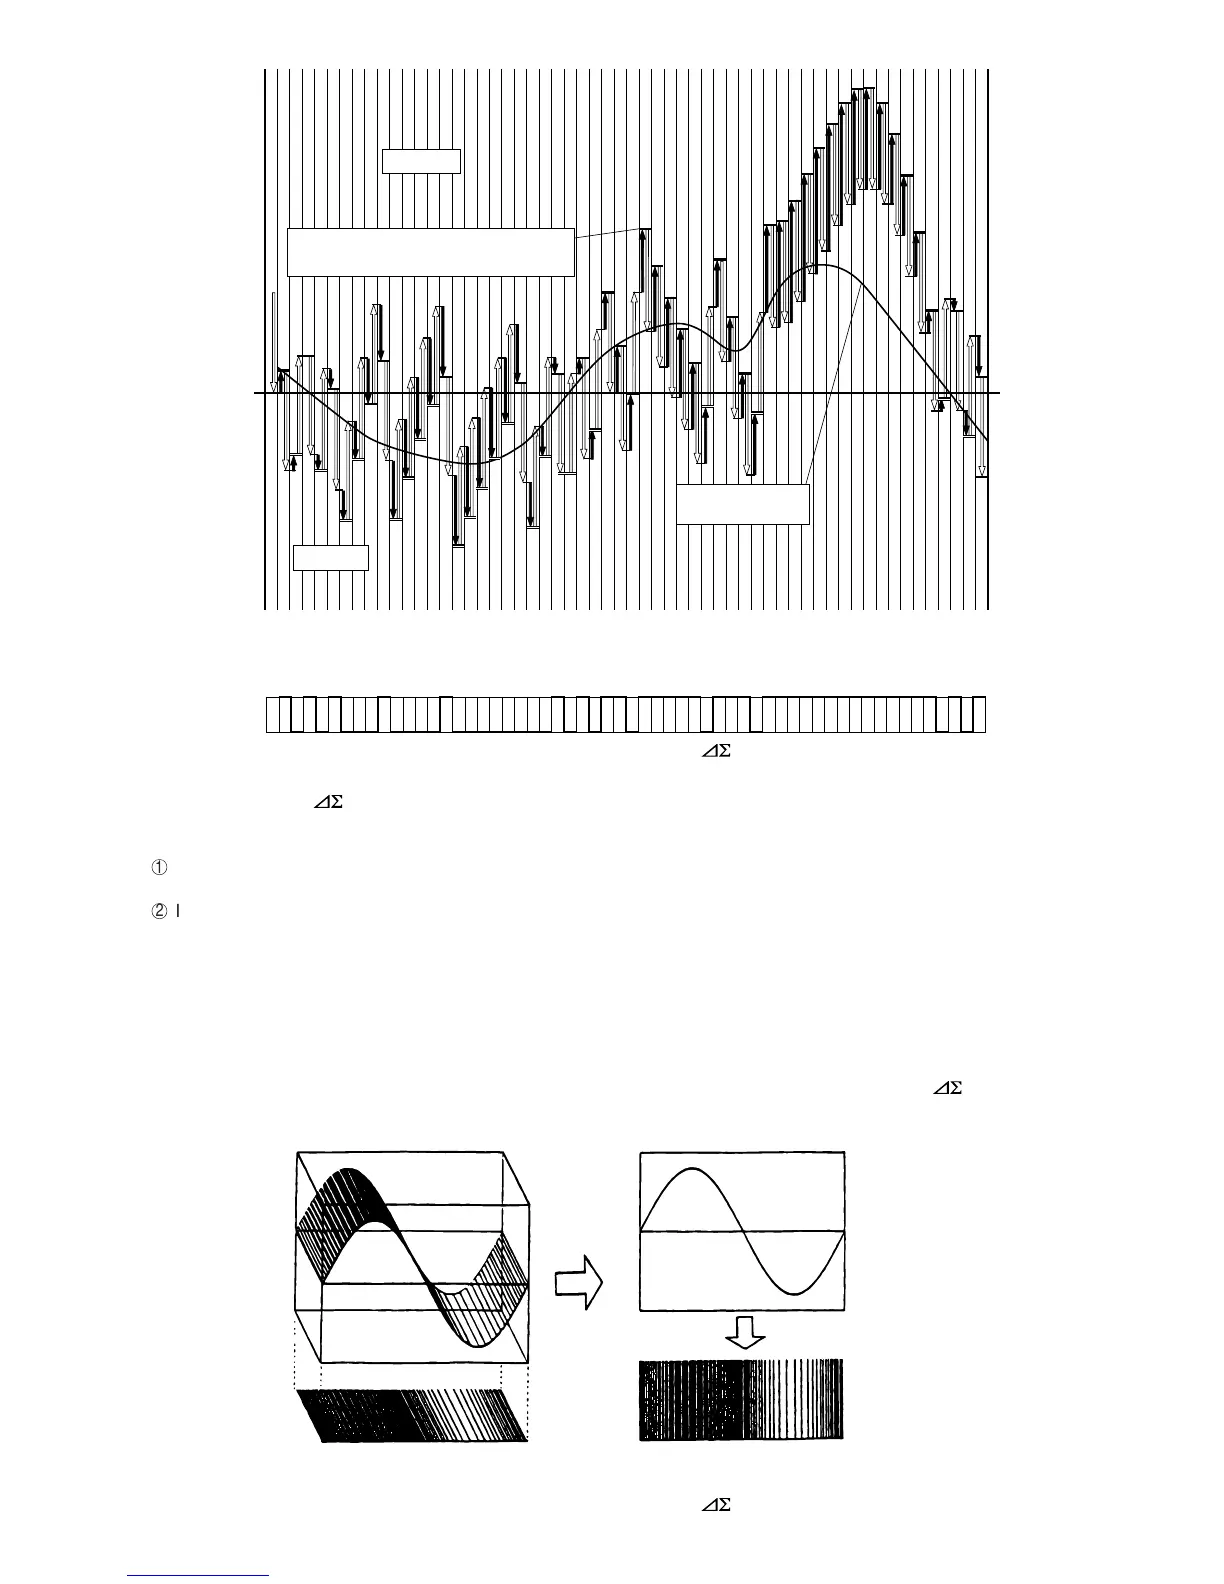
Figure 14-1 EXPLANATORY DIAGRAM OF MODULATION
101010001000010000000010101101111101110111111111111110101
ANALOG 0v-
1 BIT
SIGNAL
"0" Area
"1" Area
Integrator output : Lateral bar of thick line (-): 1
Lateral bar of doubled line (=): 0
Analog signal
waveform
The operation of the modulation is explained using Fig. 14-1. Here, the analog signal component from the input section
is expressed with the black-filled vector, and the binary value negatively fed back is expressed with the white-blank vector.
In this block, the following operation is applied.
1
If the output of the integrator is "positive", subtraction of "positive unit vector" is applied to the input side.
(In the figure, the downward white-blank vector is added.)
2
If the output of the integrator is "native", subtraction of "negative unit vector" is applied to the input side.
(In the figure, the upward white-blank vector is added.)
If the output of the integrator increases or the amplitude of the input signal increases, the figure shows that the negative
feedback is applied to suppress the increase.
In the other words, the continuous "positive" output of the integrator means that the amplitude of the input signal is large,
and the frequency of "1" coding increases.
On the contrary, the continuous "negative" output of the integrator means that the amplitude of the input signal is small,
and the frequency of "0" coding increases.
Thus, "binary codes corresponding to the amplitude" can be gained through the operation of the modulation.
Figure 14-2 EXPLANATORY DIAGRAM OF MODULATION
Slant view of analog signal
Front view of analog signal
1 Bit Signal 1 Bit Signal