Indicators in «Data» mode
In «Data» mode the following symbols appear on the screen:
29
31
30
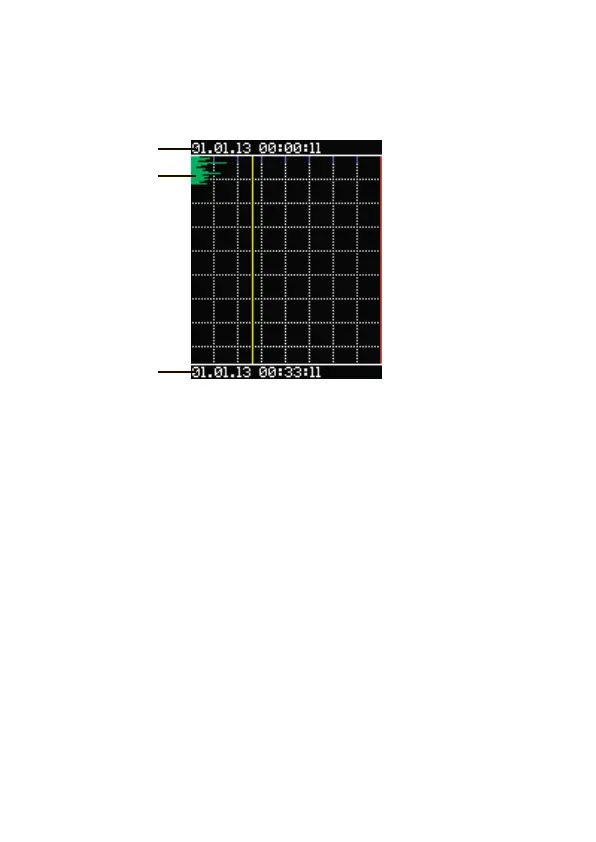
29. Date and time of the beginning of the history.
30. Date and time of the last entry in the history.
31. Bar graph showing mean radioactivity values for the whole
measurement period from the moment the device was put into operation or
from the moment the accumulated dose was reset. The graph is constantly
moving downwards, the length of the horizontal bar representing the level of
the background radiation. The bars can be green, yellow or red depending on
how seriously the preset background radiation threshold is exceeded.
To scroll the bar graph up, press the left button [↗] to scroll it
down, press the right button [↘].
To return from the «Data» mode to the menu, press the middle
button [•].