37
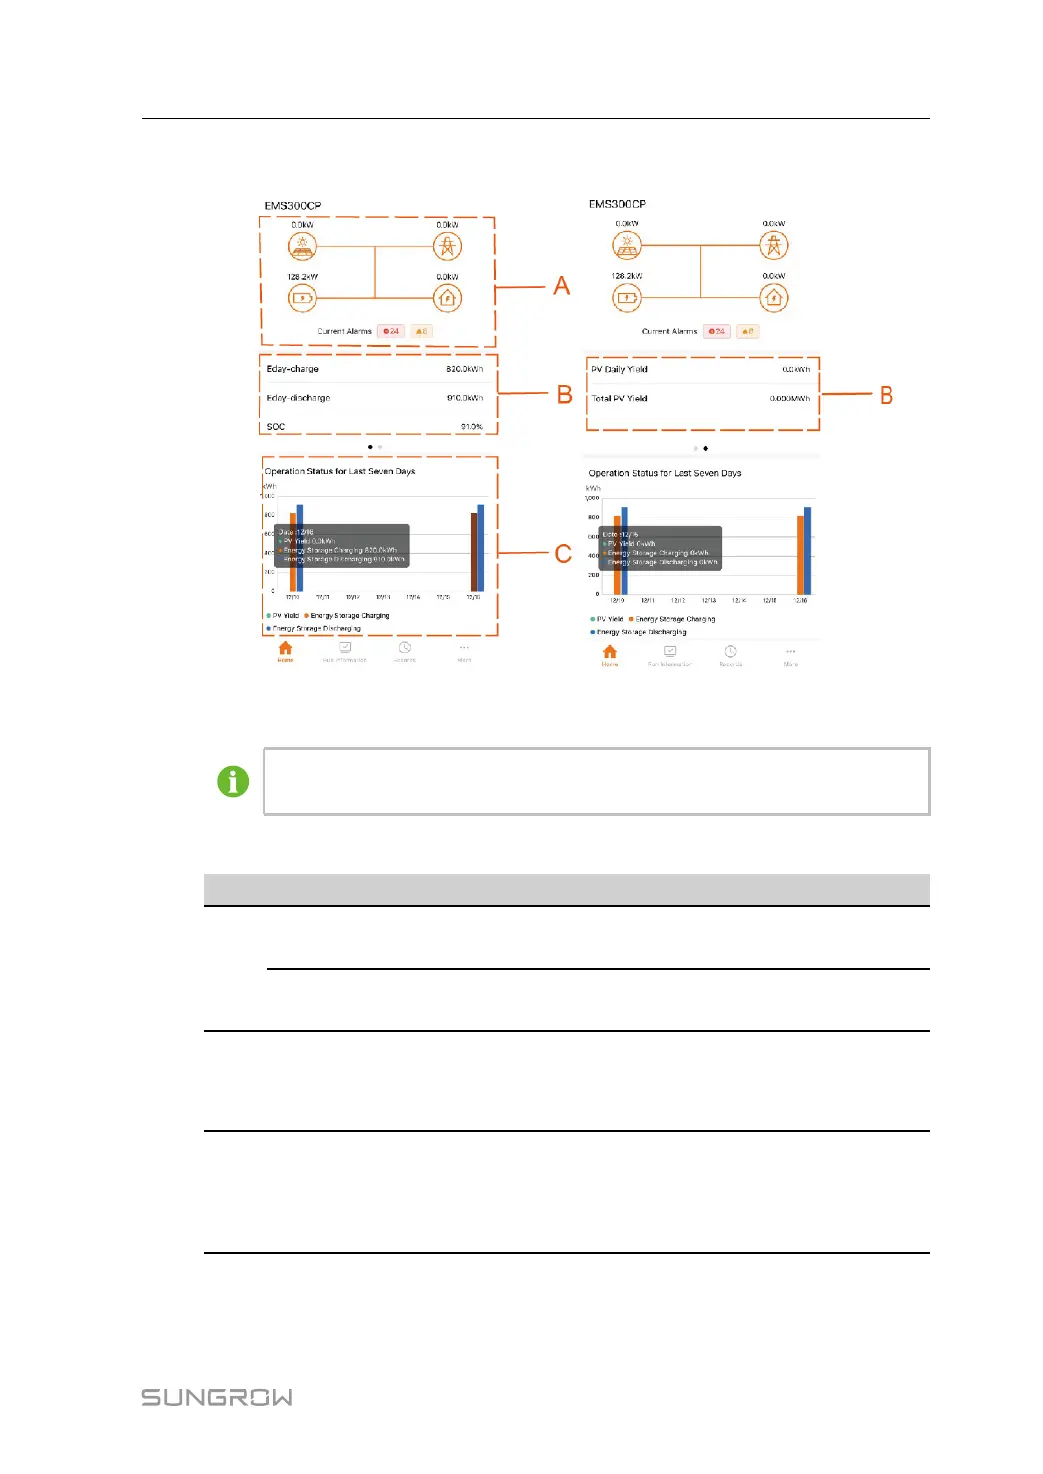
figure 2-1 Home
The figure is for reference only. The actual interface may be different and shall
prevail.
table 2-1 Home page description
No. Name
Description
A
Power flow
chart
Displays information such as PV generated output, feed in power,
energy storage power and load.
Current
Alarms
Displays the fault details of devices in the current plant and
corresponding corrective measures.
B
Plant
information
• Displays PV daily yield and total PV yield.
• Displays information such as Eday-charge, Eday-discharge,
and SOC value.
C
Operation
Status for
Last Seven
Days
Displays PV daily yield, Eday-charge, and Eday-discharge in the
past seven days.
User Manual 2 WLAN Login (Near End)
 Loading...