EasyManua.ls Logo

Technics RS-TR474

Technics RS-TR474
50 pages
To Next Page IconTo Next Page
To Previous Page IconTo Previous Page
Loading...
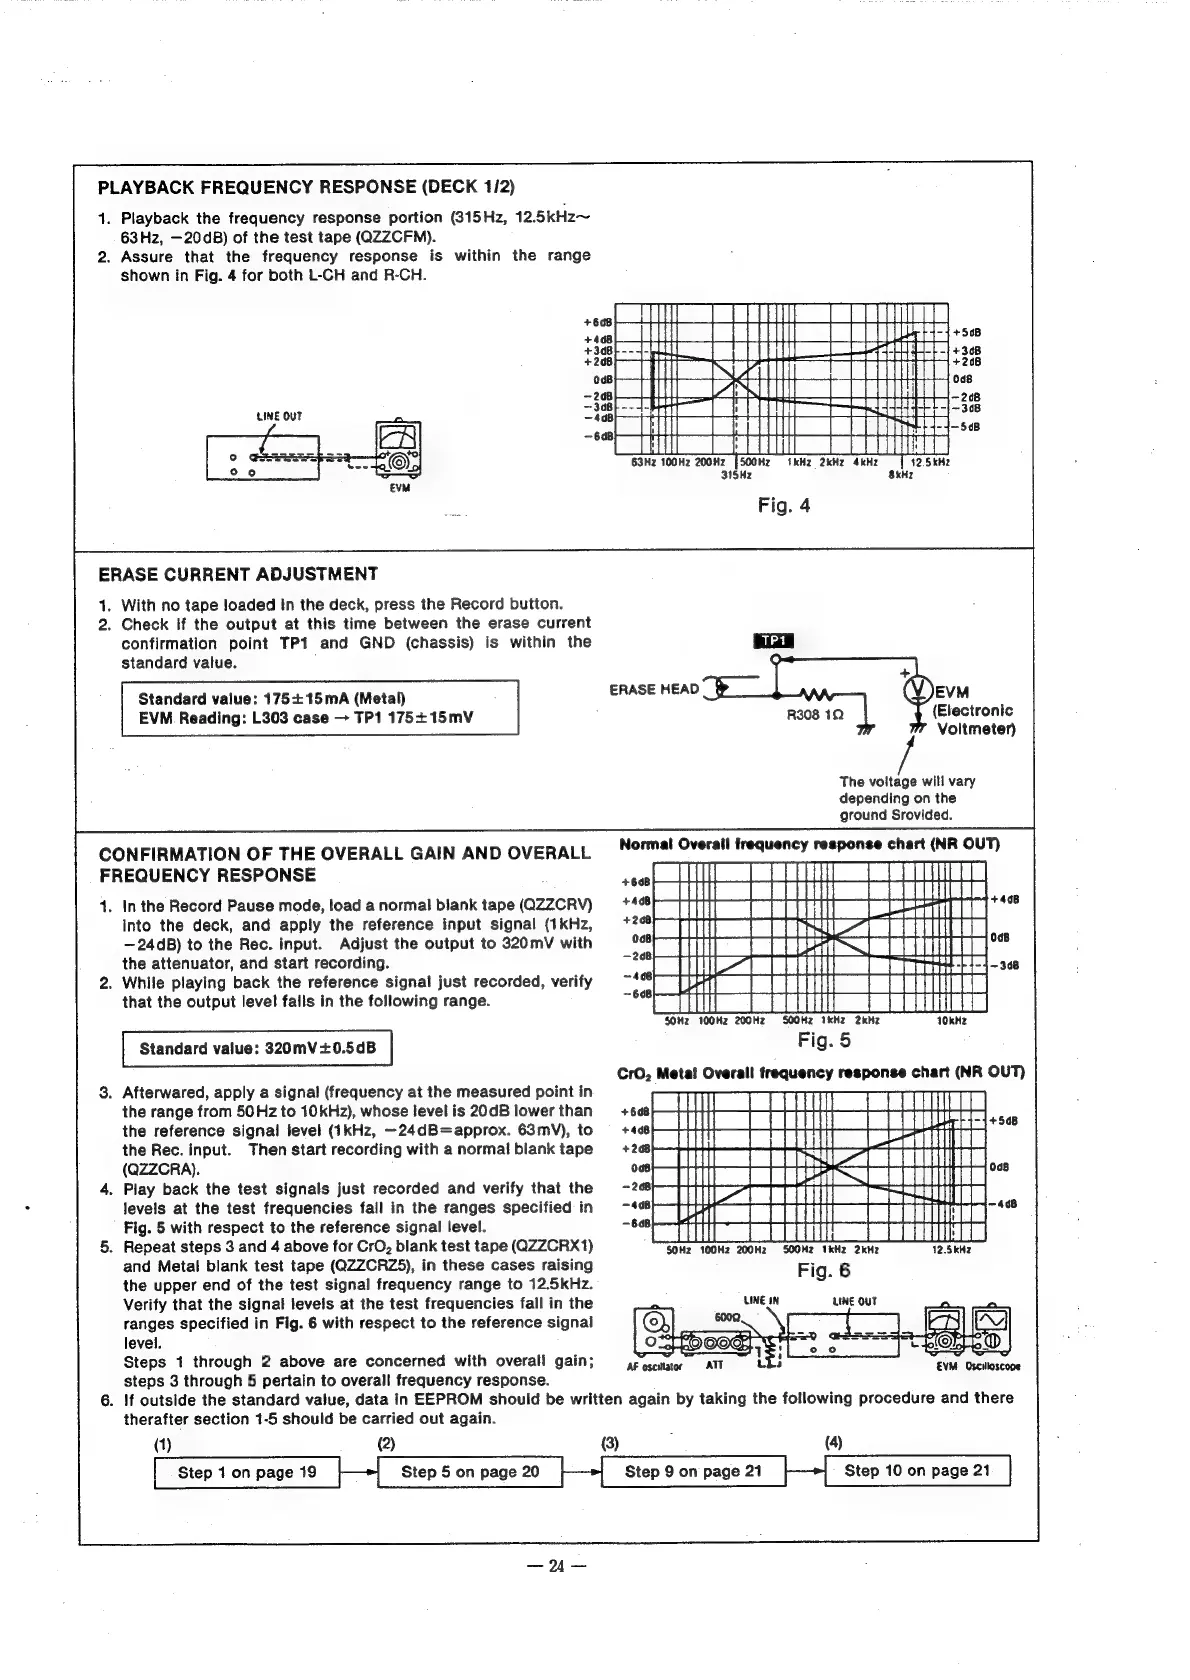
PLAYBACK
FREQUENCY
RESPONSE
(DECK
1/2)
1.
Playback
the
frequency
response
portion
(315Hz,
12.5kHz~
63Hz,
—20dB)
of
the
test
tape
(QZZCFM).
2.
Assure
that
the
frequency
response
is
within
the
range
shown
in
Fig.
4
for
both
L-CH
and
R-CH.
LINE
OUT
ERASE
CURRENT
ADJUSTMENT
1.
With
no
tape
loaded
in
the
deck,
press
the
Record
button.
2.
Check
if
the
output
at
this
time
between
the
erase
current
confirmation
point
TP1
and
GND
(chassis)
is
within
the
standard
value.
Standard
value:
175+15mA
(Metal)
ERASE
HEAD
EVM
EVM
Reading:
L303
case
TP1
175+
15mV
R308
12
(Electronic
Voltmeter)
The
voitage
will
vary
depending
on
the
ground
Srovided.
CONFIRMATION
OF
THE
OVERALL
GAIN
AND
OVERALL
Normal
Overall
frequency
response
chart
(NR
OUT)
FREQUENCY
RESPONSE
1.
In
the
Record
Pause
mode,
load
a
normal
biank
tape
(QZZCRV)
into
the
deck,
and
apply
the
reference
input
signal
(1kHz,
—24dB)
to
the
Rec.
input.
Adjust
the
output
to
320mV
with
the
attenuator,
and
start
recording.
.
While
playing
back
the
reference
signal
just
recorded,
verify
that
the
output
level
falls
in
the
following
range.
SOHz
100Hz
200Hz
SOOHz
kHz
2kHz
Standard
value:
320mV+0.5dB
Fig.
5
CrO,
Meta!
Overall
frequency
response
chart
(NR
OUT)
.
Afterwared,
apply
a
signal
(frequency
at
the
measured
point
in
the
range
from
50
Hz
to
10kHz),
whose
level
is
20dB
lower
than
PT
TT
the
reference
signal
level
(1kHz,
—24dB=approx.
63mV),
to
ee
Sian
the
Rec.
input.
Then
start
recording
with
a
normal
blank
tape
nt
TT
oth
1a
(QZZCRA).
Ni
|
.
Play
back
the
test
signals
just
recorded
and
verify
that
the
a
a
RS
au
HY
i :
Tia
mnie
levels
at
the
test
frequencies
fall
in
the
ranges
specified
in
CH
Fig.
5
with
respect
to
the
reference
signal
level.
oe
a
.
Repeat
steps
3
and
4
above
for
CrO,
blank
test
tape
(QZZCRX1)
SOHz
100H2 200Hz
SOOHZ
1kHz
2kHz
12.5kH2
and
Metal
blank
test
tape
(QZZCRZ5),
in
these
cases
raising
Fig.
6
the
upper
end
of
the
test
signal
frequency
range
to
12.5kHz.
Verify
that
the
signal
levels
at
the
test
frequencies
fall
in
the
LINE
IN
LINE
OUT
ranges
specified
in
Fig.
6
with
respect
to
the
reference
signal
level.
Steps
1
through
2
above
are
concerned
with
overall
gain;
—agosemator
ATT
“EVM.
Oscilloscope
steps
3
through
5
pertain
to
overall
frequency
response.
.
If
outside
the
standard
value,
data
in
EEPROM
should
be
written
again
by
taking
the
following
procedure
and
there
therafter
section
1-5
should
be
carried
out
again.
(1)
(2)
(3)
(4)
Step
1
on
page
19
Step
5
on
page
20
Step
9
on
page
21
Step
10
on
page
21

Other manuals for Technics RS-TR474

Related product manuals