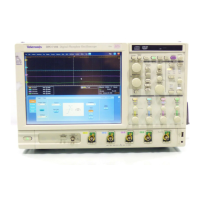
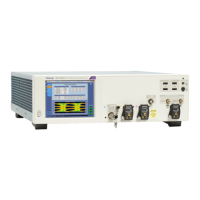
Do you have a question about the Tektronix DPO7104C and is the answer not in the manual?
Summary of safety precautions to avoid injury and product damage.
Additional safety information for product service procedures.
Details environmental and operational requirements for the instrument.
Procedure to calibrate the instrument's signal path for accuracy.
Steps to connect and configure analog signal input.
Capturing transient events and anomalies with fast acquisition.
Connecting and configuring logic probes for digital signals.
Configuring serial and parallel bus setups.
Explains trigger events, modes, and holdoff.
Using A and B triggers for sequential event capture.
Modifying trigger parameters and selecting advanced triggers.
Lists various trigger types and their conditions.
Combining A and B triggers for complex signal capture.
Adjusting trigger placement using Enhanced Triggering.
Creating overlapped eye diagrams synchronized by A trigger.
Locating problems by triggering on parallel bus signals.
Locating problems by triggering on serial bus signals.
Creating trigger conditions directly on the display screen.
Configuring actions like saving files upon event occurrence.
Acquiring waveform detail in a region separated from trigger location.
Magnifying waveforms vertically, horizontally, or in both dimensions.
Viewing and comparing multiple areas of a record simultaneously.
Locking zoomed areas and enabling auto-scrolling.
Efficiently working with long record length waveforms using Pan/Zoom.
Setting manual or automatic marks to analyze waveforms.
How to select and perform automated measurements.
Lists automated measurements by category.
Using gating and modifying statistics for measurements.
Using cursors for manual measurements on acquired data.
Displaying vertical or horizontal histograms for statistical data.
Detecting errors in high-speed serial standards.
Comparing signals to predefined templates or masks.
Comparing active signals to template waveforms for pass/fail testing.
Using FastAcq to find infrequent anomalies in signals.
| Bandwidth | 1 GHz |
|---|---|
| Channels | 4 |
| Vertical Resolution | 8 bits |
| Display Size | 12.1 inches |
| Input Coupling | AC, DC, GND |
| Record Length | 250 M points |
| Input Impedance | 1 MΩ |
| Maximum Input Voltage | 400 V |
| Trigger Modes | Edge, Pulse |
| Operating Temperature | 0°C to +50°C |
| Weight | 20 kg |
| Input Voltage Range | ±400 V (DC + peak AC) |
| Display | XGA LCD |


