Do you have a question about the Tektronix DPO7254C and is the answer not in the manual?
Manual contains warnings for safe operation and product condition.
Additional information for safe product service procedures by qualified personnel.
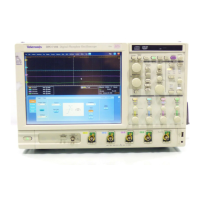
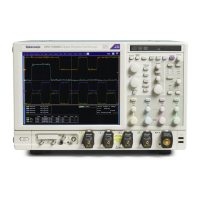
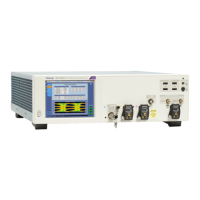
Highlights the main capabilities and specifications of the instrument series.
Details environmental and operational prerequisites for instrument use.
Specifies power supply requirements and consumption for instrument operation.
Provides instructions on how to safely turn off the instrument.
Explains the instrument's user interface elements and display features.
Describes the functions of the various physical controls on the instrument.
Procedure to run and verify the results of the instrument's internal diagnostic tests.
Procedure to calibrate the instrument's signal path for accurate measurements.
Steps to connect probes and select input channels for signal acquisition.
How to automatically configure instrument settings for signal acquisition.
Procedures to optimize probe accuracy for measurements.
Procedure to select different acquisition modes like Sample, Peak Detect, etc.
Instructions for initiating and halting waveform data acquisition.
Guide to choosing between Automatic, Constant Sample Rate, and Manual horizontal modes.
Reduces dead time between acquisitions for capturing transient events.
How to use DSP filters to extend bandwidth and improve measurements.
Adjusting termination voltage for accurate measurements on specific models.
Steps for connecting logic probes and setting up digital channels for acquisition.
How to configure digital channel threshold, size, position, and label.
Instructions for configuring serial and parallel bus parameters for analysis.
Using iCapture to analyze digital signals with analog measurement capabilities.
Captures multiple trigger events as individual records for later analysis.
Guide to selecting and configuring various trigger types available on the instrument.
Creating trigger conditions directly on the display screen by drawing areas.
Magnifying waveforms vertically, horizontally, or in both dimensions.
Viewing and comparing multiple areas of a record simultaneously.
Controls for efficiently working with long waveform records, including pan and zoom.
Techniques for marking and navigating through waveform data for analysis.
Tool for detecting and analyzing errors in serial data communications.
Comparing signals against predefined templates (masks) for pass/fail testing.
Comparing active signals against template waveforms for pass/fail testing.
Guide to creating custom control windows with frequently used instrument functions.
Steps to save screenshots of the instrument display in various formats.
Procedures for saving acquired waveform data to instrument memory or files.
Instructions for saving instrument configurations and settings.
How to load previously saved instrument configurations.
Using FastAcq and advanced triggering to find and capture infrequent signal events.
Setting up triggers for various bus protocols like I2C, SPI, USB, CAN, etc.
Critical safety precautions for using the P6616 logic probe.
| Bandwidth | 2.5 GHz |
|---|---|
| Channels | 4 |
| Display Size | 12.1 inches |
| Input Coupling | AC, DC, GND |
| Vertical Sensitivity | 1 mV/div to 10 V/div |
| Power Supply | 100-240 VAC, 50/60 Hz |
| Sample Rate | 40 GS/s |
| Record Length | 50 Mpoints |
| Vertical Resolution | 8-bit |
| Display Type | XGA LCD |
| Trigger Modes | Edge, Pulse, Runt, Timeout, Logic |
| Interface | USB, GPIB, Ethernet |
| Input Impedance | 1 MΩ ±1% with 13 pF ±2 pF; 50 Ω ±1% |
| Input Voltage Range | 1 MΩ: 300 Vrms, 50 Ω: 5 Vrms |