-9-
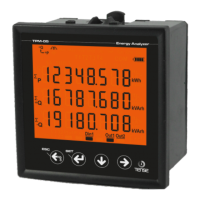
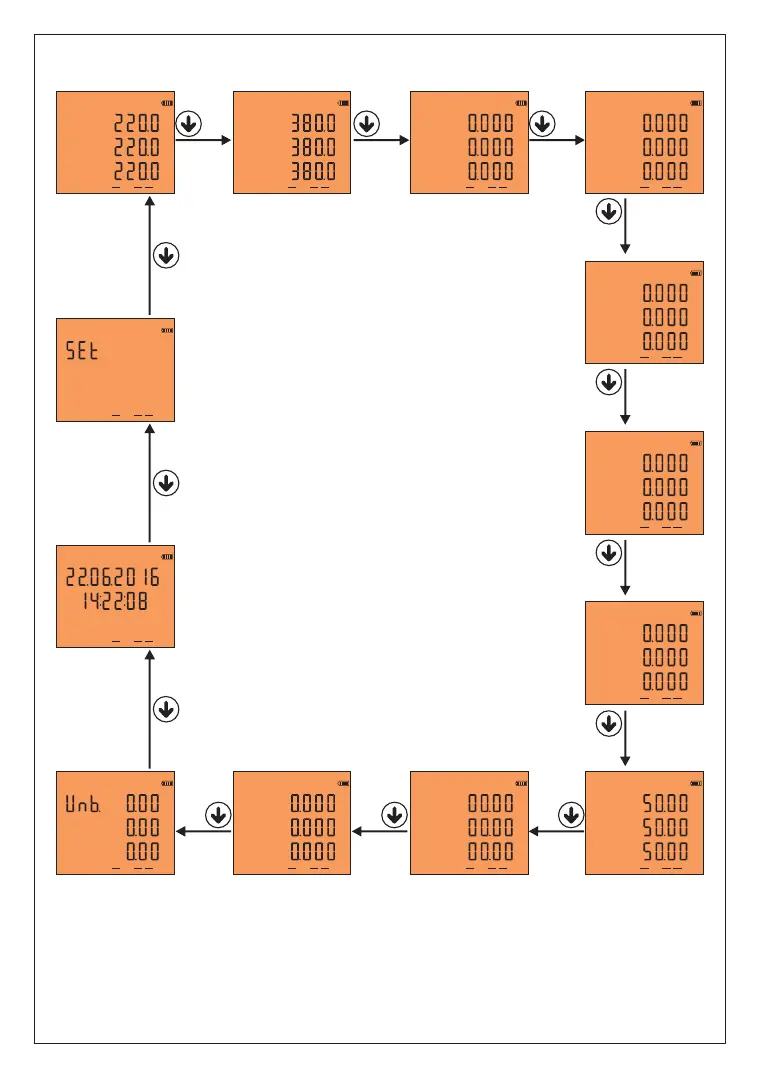
When the device is energized, Figure-4 comes to the screen.
When you press the down key, Figure-11 comes to the screen.
When you press the down key, Figure-18 comes to the screen.
When you press the down key, Figure-25 comes to the screen.
When you press the down key, Figure-30 comes to the screen.
When you press the down key, Figure-35 comes to the screen.
When you press the down key, Figure-40 comes to the screen.
When you press the down key, Figure-42 comes to the screen.
When you press the down key, Figure-43 comes to the screen.
When you press the down key, Figure-49 comes to the screen.
When you press the down key, Figure-54 comes to the screen.
When you press the down key, Figure-56 comes to the screen.
When you press the down key, Figure-57 comes to the screen.
When you press the down key, Figure-4 comes to the screen again.
10 - Fast Forwarding of Screen Information:
Figure-18
L1
L2
L3
I
A
A
A
Out1
Din1
Out2
Figure-25
L1
L2
L3
P
kW
kW
kW
Out1
Din1
Out2
Figure-4
L1
L2
L3
V
V
V
V
Out1
Din1
Out2
Figure-11
L12
L23
L31
V
V
V
V
Out1
Din1
Out2
Figure-30
L1
L2
L3
Q
kVAr
kVAr
kVAr
Out1
Din1
Out2
Figure-35
L1
L2
L3
S
Var
Var
Var
Out1
Din1
Out2
Figure-40
L1
L2
L3
PF
Out1
Din1
Out2
Figure-42
L1
L2
L3
F
Out1
Din1
Out2
Hz
Hz
Hz
Figure-43
L1
L2
L3
THD-V
Out1
Din1
Out2
%
%
%
Figure-49
Out1
Din1
Out2
kWh
kVArh
kVArh
Out1
Din1
Out2
Figure-56
Out1
Din1
Out2
Figure-57
Figure-54
V
Out1
Din1
Out2
%
%
%
Figure-4: It shows the voltage values between phase-neutral.
Figure-11: It shows phase-to-phase voltage values.
Figure-18: It shows current values.
Figure-25: It shows Active power (P) values.
Figure-30: It shows Reactive power (Q) values.
Figure-35: It shows Apparent power (S) values.
Figure-40: It shows Power factor (PF) values.
Figure-42: It shows the frequency values.
Figure-43: It shows Total voltage harmonic values.
Figure-49: It shows Total energy (active and reactive) values.
Figure-54: It shows Percentage of voltage imbalance.
Figure-56: It shows the date and time.
Figure-57: It is used to enter the menu.
Σ
P
Σ
+Q
Σ
-Q