Out1
Din1
Out2
kWh
kWh
kWh
Out1
Din1
Out2
kVArh
kVArh
kVArh
Out1
Din1
Out2
kVArh
kVArh
kVArh
Out1
Din1
Out2
kWh
kWh
kWh
Figure-50 Figure-51 Figure-52 Figure-53
Figure-45 Figure-46 Figure-47 Figure-48 Figure-49
L1
THD-I
Out1
Din1
Out2
%
%
%
Out1
Din1
Out2
kWh
kVArh
kVArh
L1
THD-V
Out1
Din1
Out2
%
%
%
L1
THD-V
Out1
Din1
Out2
L1
THD-I
Out1
Din1
Out2
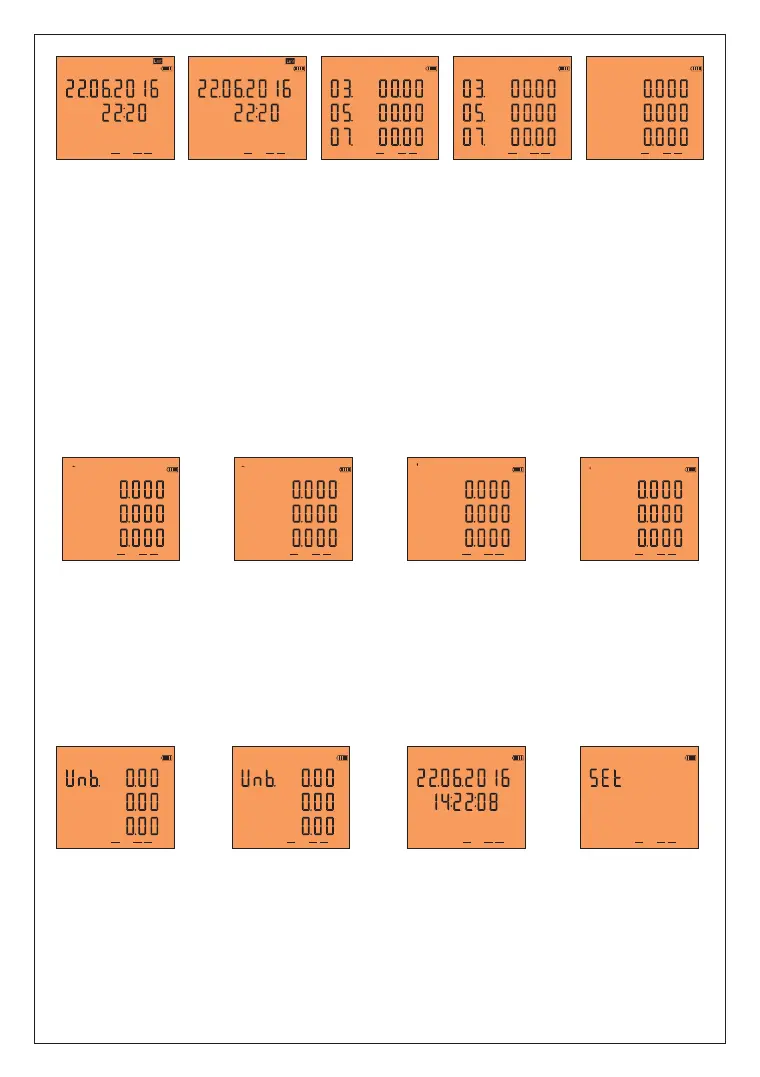
Figure-45: It shows the date and time of each phase exceeding (>%20) THD-V limit. When you press the
right button, the values of the L2 and L3 phases are displayed on the screen respectively. When the right
button is pressed; Figure-46 comes to the screen.
Figure-46: It shows the date and time of each phase exceeding (>%20) THD-I limit. When you press the
right button, the values of the L2 and L3 phases are displayed on the screen respectively. When the right
button is pressed; Figure-47 comes to the screen.
Figure-47: Voltage harmonics values of up to 55th harmonics are displayed on each screen, with 3 values
per screen. . When you press the right button, the values of the L2 and L3 phases are displayed on the
screen respectively. When the right button is pressed; Figure-48 comes to the screen.
Figure-48: Current harmonics values of up to 55th harmonics are displayed on each screen, with 3 values
per screen. When you press the right button, the values of the L2 and L3 phases are displayed on the screen
respectively. When the right button is pressed; Figure-49 comes to the screen.
Figure-49: It shows the import active, inductive reactive and capacitive reactive energy values which
belongs to total of the phase. When the right button is pressed; Figure-50 comes to the screen.
-8-
Figure-50: It shows the value of import active energy which belongs to each phase. When the right button
is pressed; Figure-51 comes to the screen.
Figure-51: It shows the value of export active energy which belongs to each phase. When the right button
is pressed; Figure-52 comes to the screen.
Figure-52: It shows the value of inductive reactive energy which belongs to each phase. When the right
button is pressed; Figure-53 comes to the screen.
Figure-53: It shows the value of capacitive reactive energy which belongs to each phase. When the right
button is pressed; Figure-54 comes to the screen.
I
Out1
Din1
Out2
%
%
%
Figure-54 Figure-55
Out1
Din1
Out2
Figure-56
Out1
Din1
Out2
Figure-57
Figure-54: It shows the voltage irregularities of the phases with each other. When the right button is
pressed; Figure-55 comes to the screen.
Figure-55: It shows the current irregularities of the phases with each other. When the right button is
pressed; Figure-56 comes to the screen.
Figure-56: It shows the date and time. When the right button is pressed; Figure-57 comes to the screen.
Figure-57: It is used to make settings related to the device. When you press the right button, Figure-4
comes to the screen.
V
Out1
Din1
Out2
%
%
%
-P
L1
L2
L3
+P
L1
L2
L3
+Q
L1
L2
L3
-Q
L1
L2
L3
Σ
P
Σ
+Q
Σ
-Q