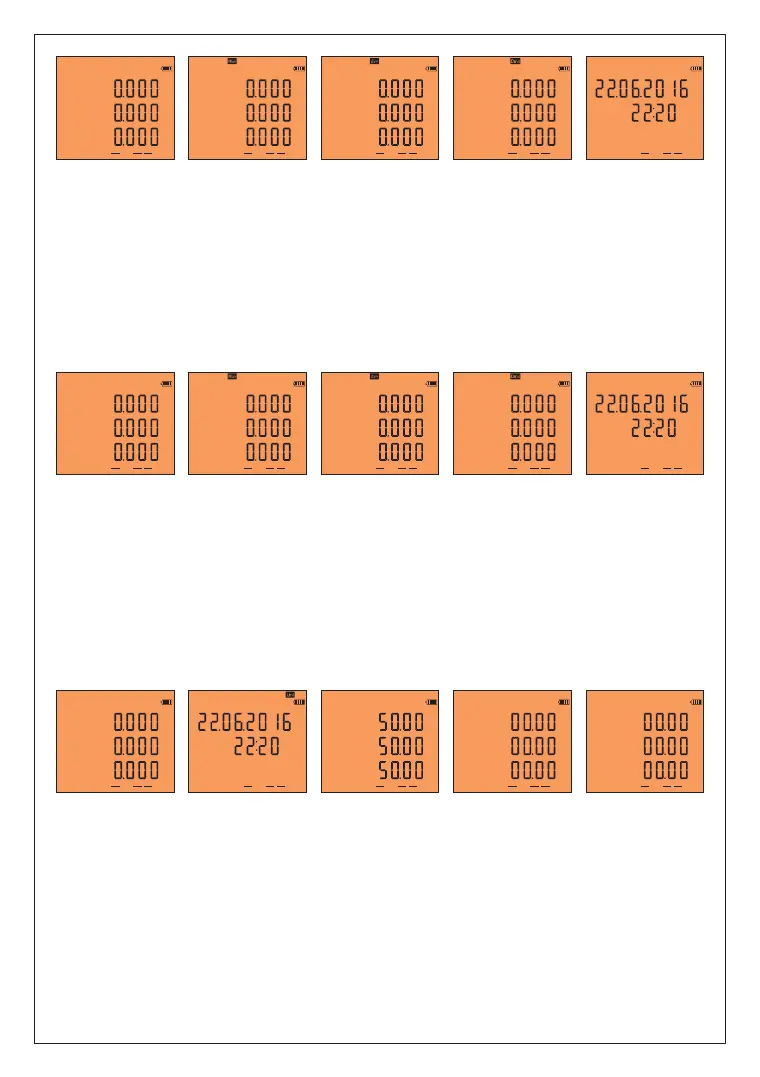
Figure-30: It shows the reactive power value(Q) which belongs to each phase. When the right button is
pressed; Figure-31 comes to the screen.
Figure-31: It shows the maximum reactive power value(Max)which belongs to each phase. When the right
button is pressed; Figure-32 comes to the screen.
Figure-32: It shows average(Ave) reactive power(Q) which belongs to each phase. When the right button
is pressed; Figure-33 comes to the screen.
Figure-33: It shows the demand(Dmd) of reactive power(Q) which belongs to each phase. When the right
button is pressed; Figure-34 comes to the screen.
Figure-34: It shows the dates and time values of the reactive power(Q)'s demand. When the right botton
is pressed values of L2 and L3 phases comes to the screen subsequently. When the right button is pressed;
Figure-35 comes to the screen.
Figure-35: It shows apparent power (S)which belongs to each phase. When the right button is pressed;
Figure-36 comes to the screen.
Figure-36: It shows maximum(Max) apparent power(S) value which belongs to each phase. When the
right button is pressed; Figure-37 comes to the screen.
Figure-37: shows average(Ave) apparent power(S) which belongs to each phase. When the right button is
pressed; Figure-38 comes to the screen.
Figure-30 Figure-31 Figure-32 Figure-33 Figure-34
L1
L2
L3
Q
kVAr
kVAr
kVAr
Out1
Din1
Out2
Q
L1
L2
L3
kVAr
kVAr
kVAr
Out1
Din1
Out2
Q
L1
Out1
Din1
Out2
Q
L1
L2
L3
kVAr
kVAr
kVAr
Out1
Din1
Out2
Q
L1
L2
L3
kVAr
kVAr
kVAr
Out1
Din1
Out2
Figure-35 Figure-36 Figure-37 Figure-38
Figure-39
L1
L2
L3
S S S S S
Var
Var
Var
Out1
Din1
Out2
L1
L2
L3
Var
Var
Var
Out1
Din1
Out2
L1
L2
L3
Var
Var
Var
Out1
Din1
Out2
L1
L2
L3
Var
Var
Var
Out1
Din1
Out2
L1
Out1
Din1
Out2
-7-
Figure-38: It shows the demand(Dmd) of apparent power(S) which belongs to each phase. When the right
button is pressed; Figure-39 comes to the screen.
Figure-39: It shows the dates and time values of the apparent power(S)'s demand. When the right button
is pressed; Figure-40 comes to the screen.
Figure-40
Figure-41 Figure-42 Figure-43 Figure-44
L1
L2
L3
PF
Out1
Din1
Out2
L1
L2
L3
F
Out1
Din1
Out2
Hz
Hz
Hz
L1
L2
L3
THD-V
Out1
Din1
Out2
%
%
%
L1
L2
L3
THD-I
Out1
Din1
Out2
%
%
%
L1
PF
Out1
Din1
Out2
Figure-40: It shows the power factor value(PF)Which belong to each phase. When the right button is
pressed; Figure-41 comes to the screen.
Figure-41: It shows time and dates of each phase when the power factor limit (<0.80) of each phase is
lowered(Lmt). When the right button is pressed values of L2 and L3 phases comes to the screen
subsequently. When the right button is pressed; Figure-42 comes to the screen.
Figure-42: It shows the frequency value of each phase. When the right button is pressed; Figure-43
comes to the screen.
Figure-43: It shows total harmonic distortion value(THD-V) which belongs to voltage of the phase. When
the right button is pressed; Figure-44 comes to the screen.
Figure-44: It shows total harmonic distortion value(THD-I)which belongs to current of the phase. When
the right button is pressed; Figure-45 comes to the screen.