Figure-18 Figure-19 Figure-20 Figure-21 Figure-22
L1
L2
L3
I
A
A
A
Out1
Din1
Out2
L1
L2
L3
I
A
A
A
Out1
Din1
Out2
L1
L2
L3
I
A
A
A
Out1
Din1
Out2
L1
L2
L3
I
A
A
A
Out1
Din1
Out2
L1
L2
L3
I
A
A
A
Out1
Din1
Out2
Figure-18: It shows current values of each phase. When you press the right key, figure-19 comes to
the screen.
Figure-19: It shows the minimum (Min) current values of each phase. When you press the right key,
figure-20 comes to the screen.
Figure-20: It shows the maximum (Max) current values of each phase. When you press the right key,
Figure-21 comes to the screen.
Figure-21: It shows the average (Ave) current values of each phase. When you press the right key,
Figure-22 comes to the screen.
Figure-22: It shows current demand (Dmd) values for each fuse. When you press the right key,
Figure-23 comes to the screen.
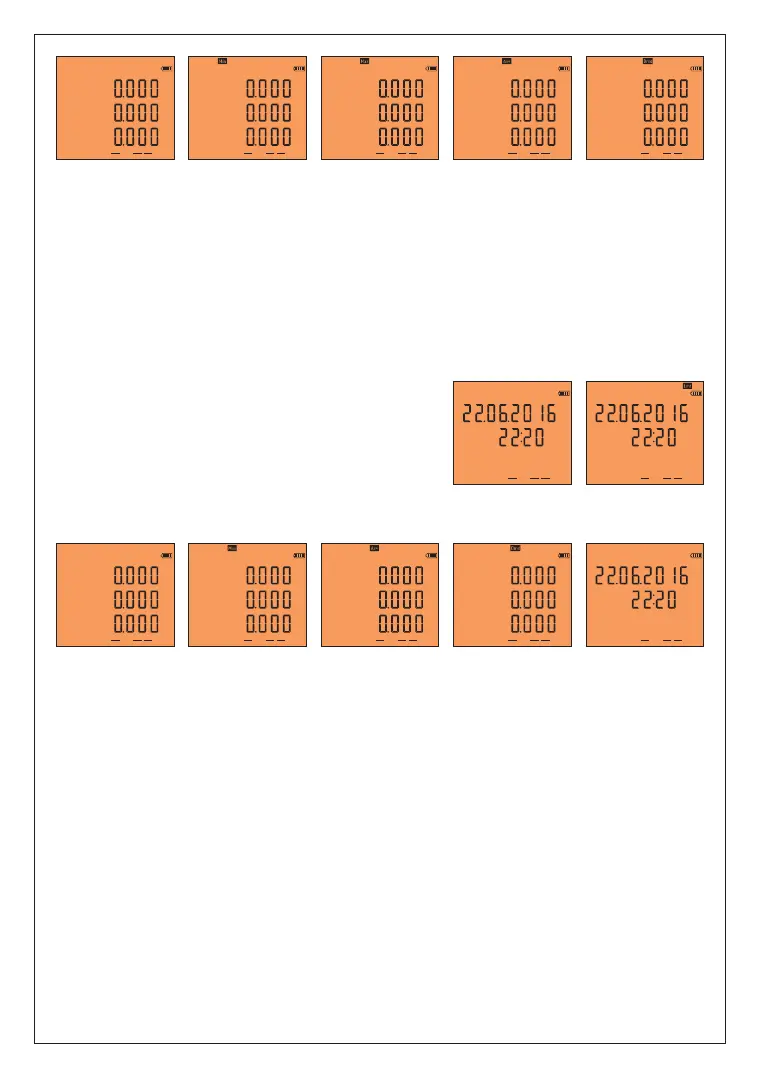
Figure-23: It shows the time and date of demands which
belongs to each phase. When you press the right key ,values
which belongs to the L2 and L3 comes to the screen
subsequently. When you press the right key, Figure-24 comes
to the screen.
Figure-24: It shows the time and date which current limit
(>Ctr x 0.80) of each phase is exceeded. When you press the
right key ,values which belongs to the L2 and L3 comes to the screen
subsequently. When you press the right key, Figure-25 comes to the screen.
Figure-23
L1
I
Out1
Din1
Out2
Figure-24
L1
I
Out1
Din1
Out2
-6-
Figure-25: It shows the active power (P) values for each zone. When you press the right button, the screen
will show figure-26.
Figure-26: It shows the maximum active power (P) values for each zone. When you press the right key
figure-27 comes to the screen.
Figure-27: It shows average(Ave) active power(P) value of each phase. When you press the right key,
Figure-28 comes to the screen.
Figure-28: It shows the active power (P) demand (Dmd) values for each zone. When you press the right
key, Figure-29 comes to the screen.
Figure-29: It shows the time and date of active power(P) demands of each phase. When you press the
right key ,values which belongs to the L2 and L3 comes to the screen subsequently. When you press the
right key,Figure-30 comes to the screen.
Figure-25 Figure-26 Figure-27 Figure-28
Figure-29
L1
L2
L3
P
kW
kW
kW
Out1
Din1
Out2
P
L1
L2
L3
kW
kW
kW
Out1
Din1
Out2
P
L1
Out1
Din1
Out2
P
L1
L2
L3
kW
kW
kW
Out1
Din1
Out2
P
L1
L2
L3
kW
kW
kW
Out1
Din1
Out2