8 Using the product
16
In all application menus, apart from the volume flow measurement, there are
three different screens for the measurement - Live (or also Basic view), Graphic
and Table.
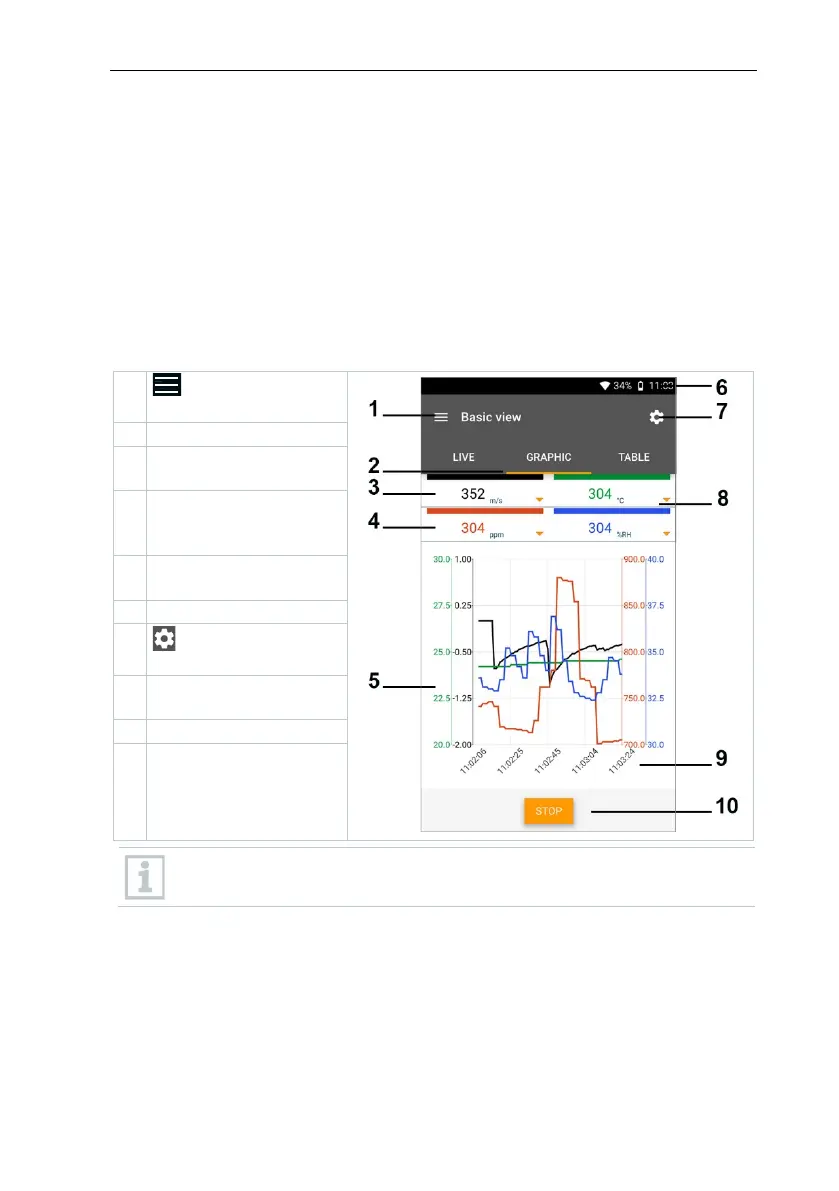
8.4.1.1 Graphic view
In the Graphic view, the values for a maximum 4 channels can be displayed
simultaneously in a chronological trend graph. All measured parameters can be
displayed in the Graphic view via the channel selection (click on one of the four
selection fields). Once a measurement parameter has been selected, the value
is updated automatically.
The Zoom touch function allows individual parts of the graphic to be viewed in
more detail or time progressions to be displayed compactly.
Open the main
Reading for selected
channel
parameter and
Graphic with selected
channels and 4 Y-axes
Open the
Selection of other
channels
button
If multiple probes are connected, please refer to the color the probe is
associated with. Y axis may not align with other probe measurements.