TIp 8: Finding the Best Line of Fit for a Set of Data
Topics in Algebra 1 © 2001 Texas Instruments
³
TIp 8-2
³
Try-It!
é
on Your TI
.
83 Plus or TI
.
73
You have collected the measurements (in inches) of how far a boy could throw a ball above his
head from age 5 to age 14. The following data was recorded. Create a scatter (
Ô
) plot based on
these lists, where
Xlist=L
1
and
YList= L
2
.
Age in years (L
1
) Distance in inches (L
2
)
5 66.9
8 75.8
9 77.7
10 79.9
12 85.8
14 91.7
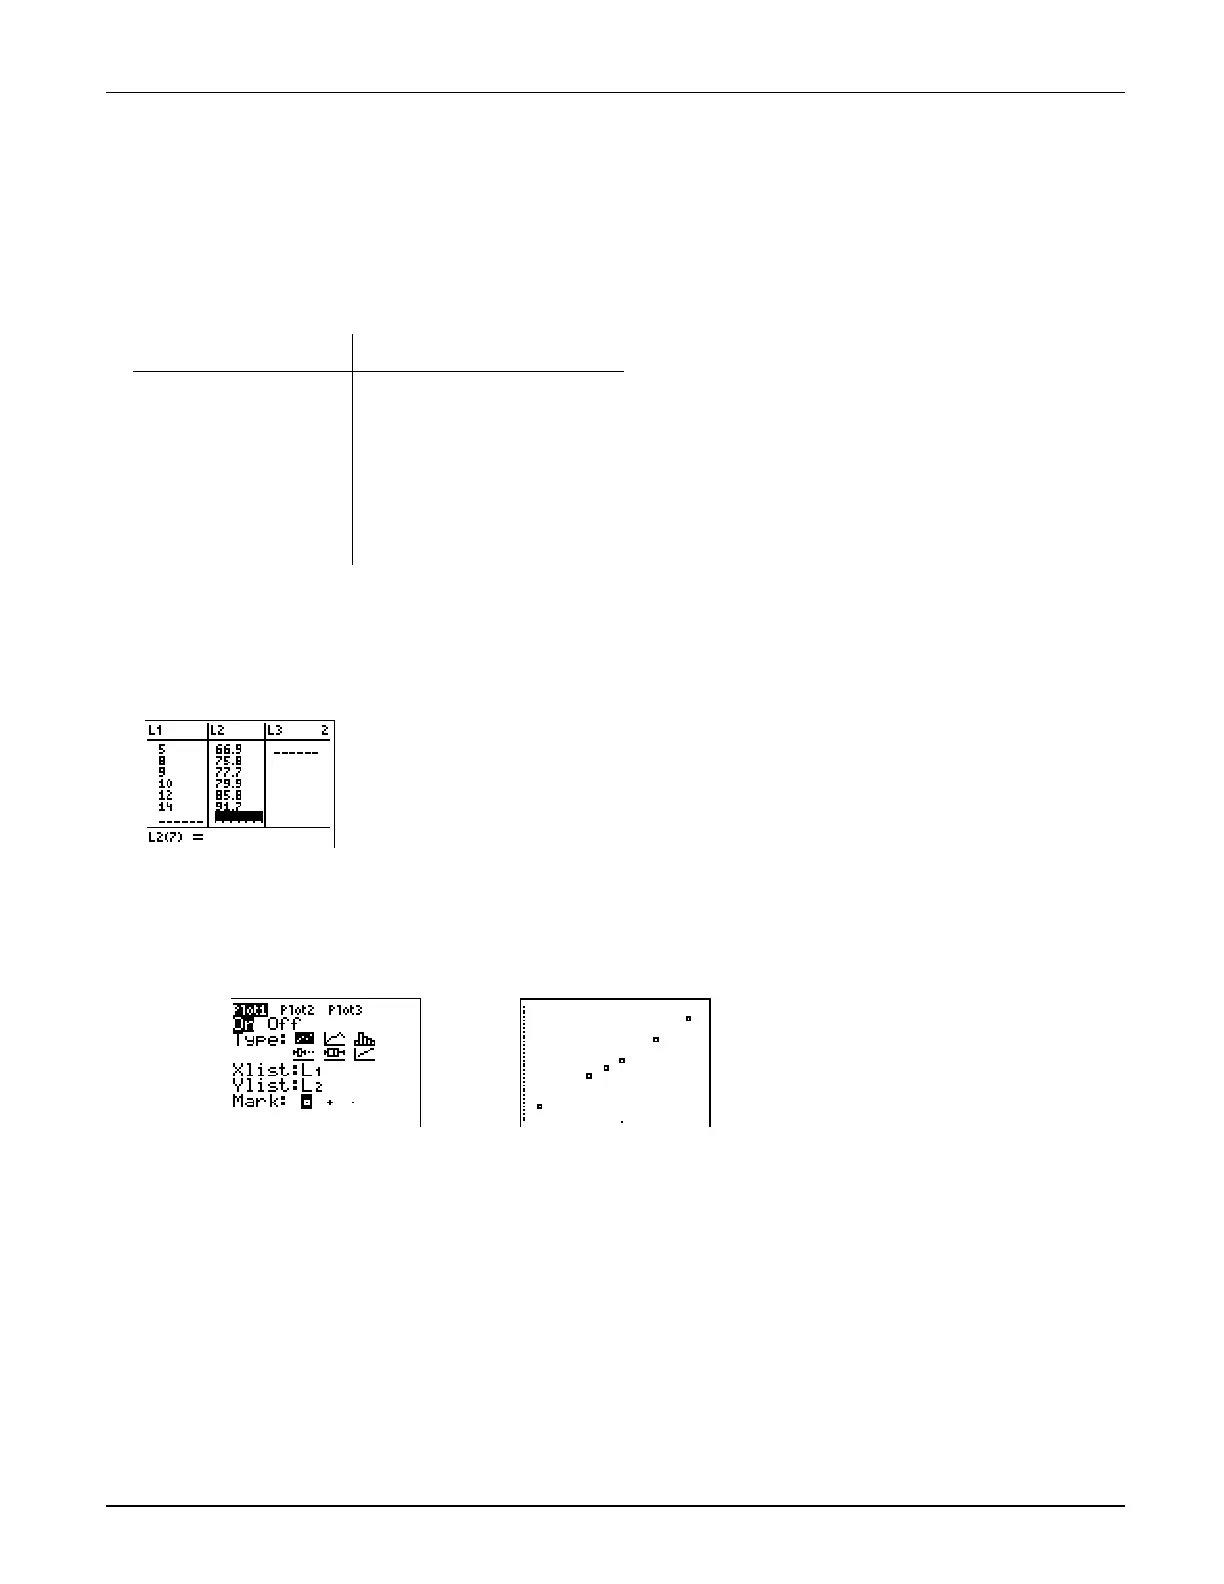
Enter the Lists for the Statistical Plot
See
³
TIp 6:
Using Lists
for step-by-step instructions for entering lists of data. Your list editor
should look like this:
Create a Scatter Statistical Plot for L1 and L2
See
³
TIp 7:
Creating a Statistical Plot
for step-by-step instructions for creating a scatter
statistical plot. Your statistical plot editor and scatter plot (using
ZoomStat
) should look like this:
Note:
The stat plot editor in the TI
-
73 looks slightly different.
Stat Plot Editor
Graph of Plot
 Loading...


