TIp 8: Finding the Best Line of Fit for a Set of Data
Topics in Algebra 1 © 2001 Texas Instruments
³
TIp 8-3
³
Try-It!
é
on Your TI
.
83 Plus or TI
.
73
(continued)
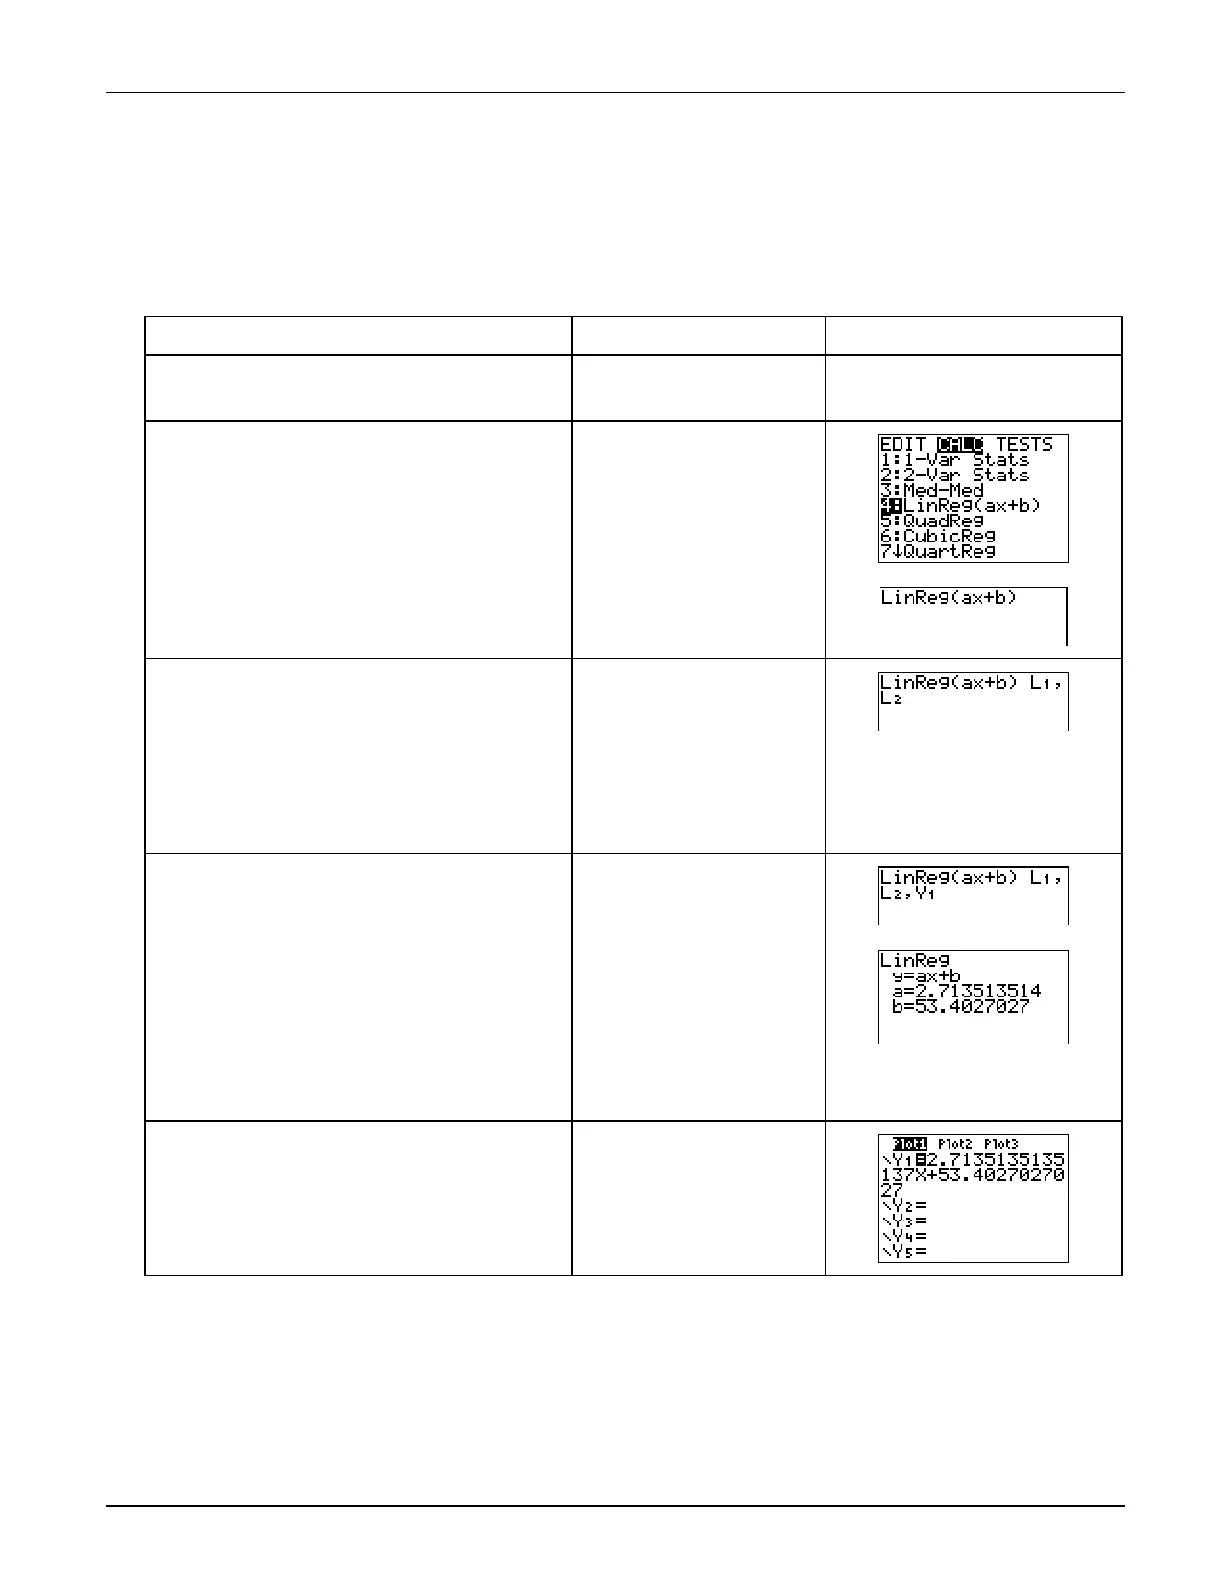
Find the Linear Regression for the Scatter Plot
Find the regression (the line which best fits the data) for
L
1
and
L
2
using
LinReg(ax+b)
.
To Do This Press Display
(TI-83 Plus shown)
1. Return to the Home screen, and clear
it.
-
l
:
2. Select
LinReg(ax+b)
from the
STAT
CALC
menu.
TI
-
83 Plus:
…
"
4:LinReg(ax+b)
TI
-
73:
-
v
!
5:LinReg(ax+b)
3. Select the lists
L
1
and
L
2
.
TI
-
83 Plus:
y 9
1:L
1
¡
y 9
2:L
2
¡
TI
-
73:
-
v
1:L
1
¡
-
v
2:L
2
¡
4. Display
Y-VARS
menu. Then select
the Y variable (
Y
1
) from the
FUNCTION
menu.
5. Calculate the regression equation.
TI
-
83 Plus:
~
1:Function
1:Y
1
b
TI
-
73:
-
}
2:Y-Vars
1:Y
1
b
6. Display the Y= editor.
Note
: Both
Y
1
and
Plot1
are highlighted. This
means that both graph and the plot are turned on.
&

 Loading...


