TIp 8: Finding the Best Line of Fit for a Set of Data
Topics in Algebra 1 © 2001 Texas Instruments
³
TIp 8-4
³
Try-It!
é
on Your TI
.
83 Plus or TI
.
73
(continued)
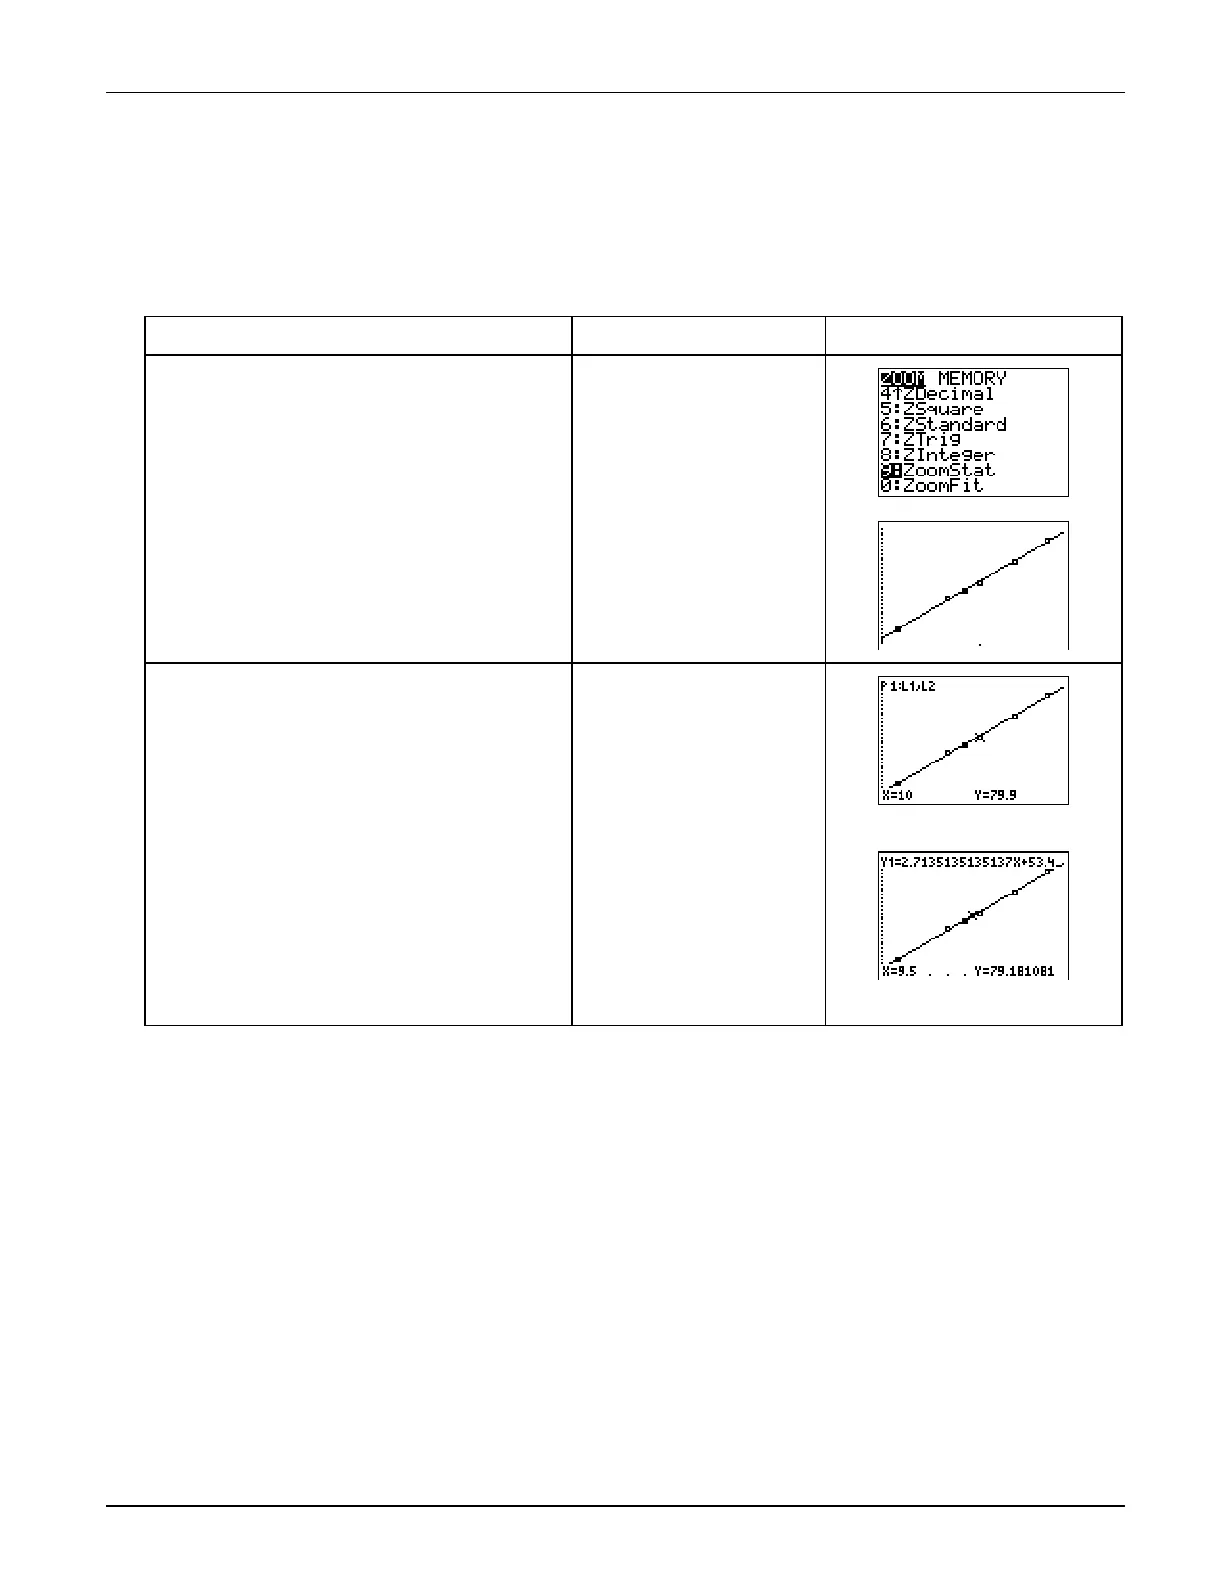
Graph the Statistical Plot and the Linear Regression
Graph and trace the statistical plot and linear regression at the same time and compare them.
To Do This Press Display
(TI-83 Plus shown)
1. Select the
ZoomStat
function to
display the statistical plot and the
regression on the graph screen at the
same time.
TI
-
83 Plus:
q
9:ZoomStat
TI
-
73:
q
7:ZoomStat
2. Trace the function or the statistical
plot.
Notes
: The function or plot being traced is
displayed in the upper left corner of the screen. The
X
and
Y
coordinates display at the bottom of the
screen.
r
| or ~ to trace a
function
} and † to move
between functions
Tracing along the stat plot
Tracing along the line
On Your Own
³
Use the function to predict approximately how far you think the boy can throw the ball
above his head at 18 years old. Do you think the line will give a good idea of how high this
person will be able to throw the ball when he is 35? Explain your thoughts.
Hint:
Use the table to determine the value of
Y
1
when
X=18
.

 Loading...


