Local tlist,xlist,exp2
ClrDraw
DispG
DelVar τy1,τy2
exp1|y=τy2→exp2
exp1|y=τy1→exp1
augment(seq(expr("when("&string(exp1|x=xx)&",τy1,0)"),xx,xmin,xmax,„x*2),seq(exp
r("when("&string(exp2|x=xx)&",τy2,0)"),xx,xmin+„x,xmax,„x*2))→tlist
augment(seq(x,x,xmin,xmax,2*„x),seq(x,x,xmin+„x,xmax,2*„x))→xlist
For τy1,ymin,ymax,„y*2
τy1+„y→τy2
PtOn xlist,tlist
EndFor
DelVar τy1,τy2
EndPrgm
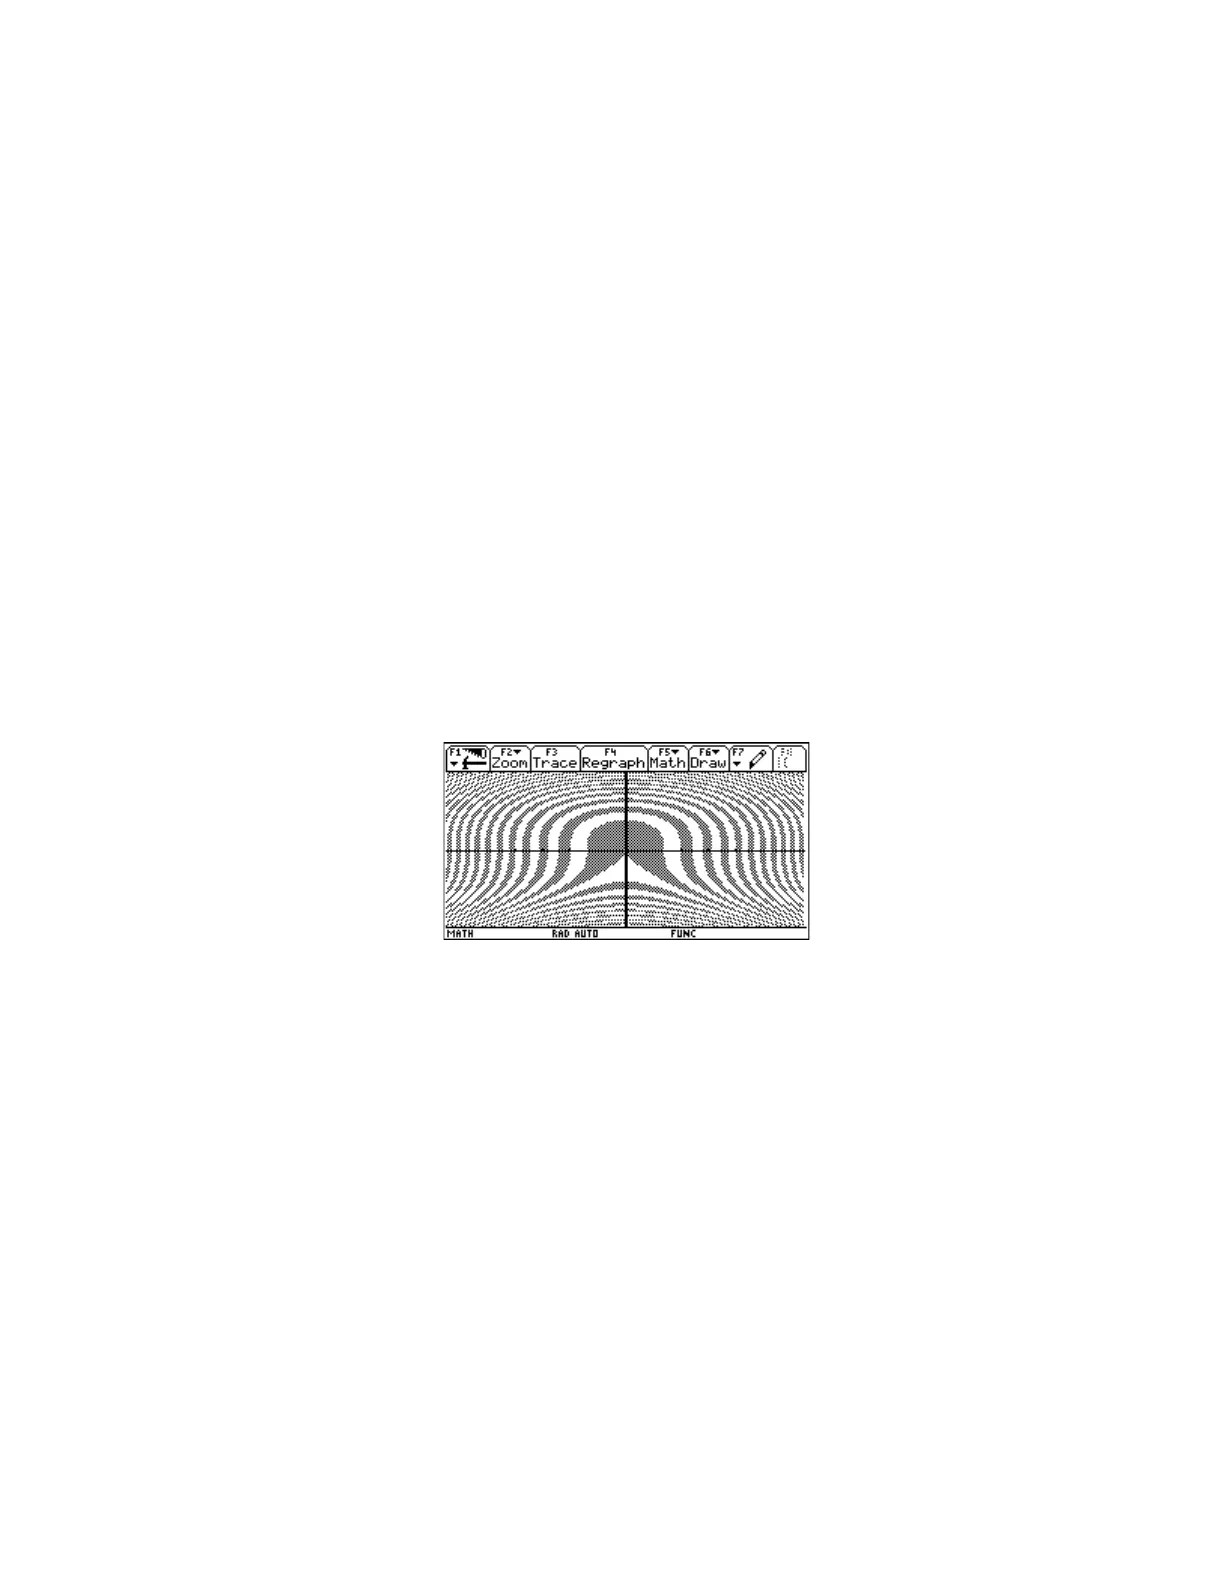
exp1 is the expression to be plotted, which must evaluate to true or false. The window variables xmin,
xmax, ymin and ymax must be set before this program is called. This program will work on both the 89
and the 92+, since the program plots to view window coordinates, not absolute pixel coordinates. This
program has a hard-coded plot resolution of 2, which means that the function is evaluated at every
other y- and x-coordinate. This results in a plot that looks like this, for the expression mod(x^2 + y^3, 4)
< 2 for x from -6.5 to 6.5, and for y from -3.1 to 3.2,
Press ON while the program is running to stop it. When the program finishes, the plot is shown until
you press [HOME].
Here is a minor variation of the program that sets the window limits as arguments, and also lets you set
the plot resolution.
truthd(exp1,xxmin,xxmax,yymin,yymax,res)
Prgm
©Truth plot
©Minor change to Andrew Cacovean's truth() program
©12jan00/dburkett@infinet.com
Local tlist,xlist,exp2
xxmin→xmin
xxmax→xmax
yymin→ymin
yymax→ymax
ClrDraw
4 - 3