Redstone™ OSA305 Chapter 3: Using the OSA
Page 10 STN053070-D03
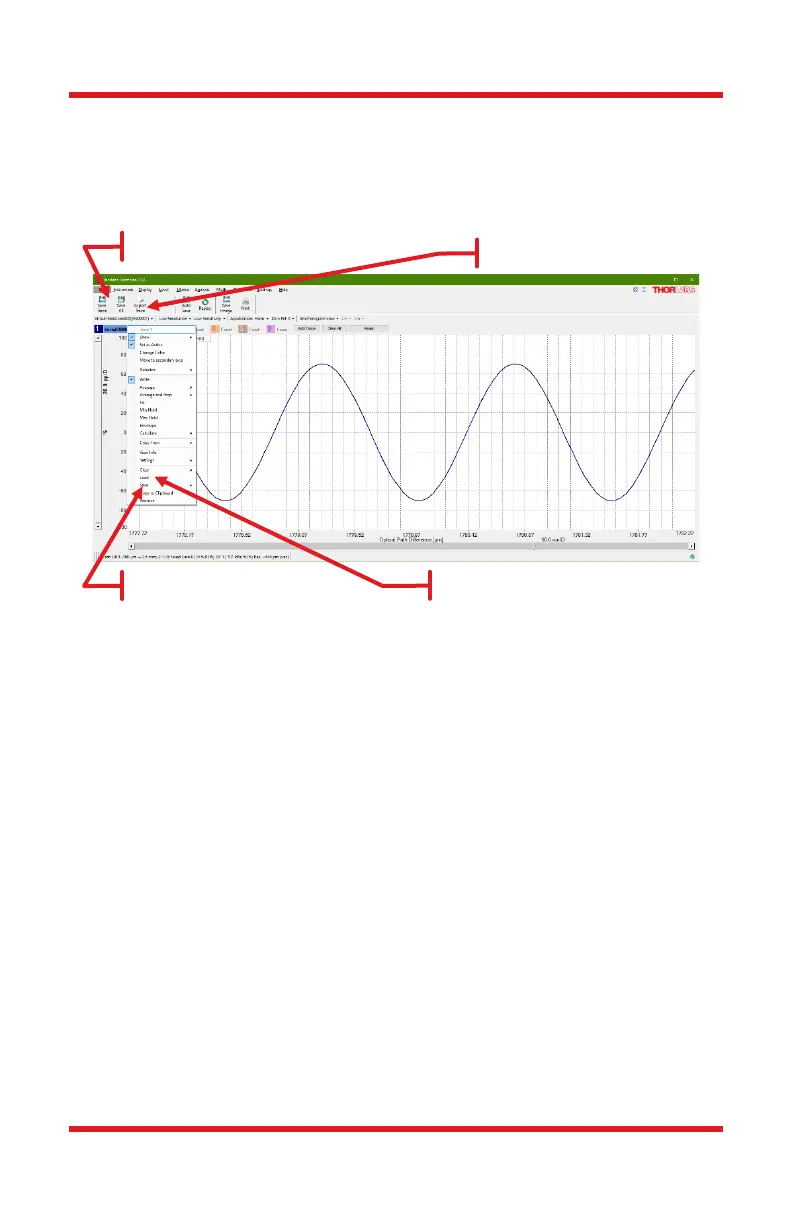
3.4.2. Saving Your Data
The data can be saved by selecting the File menu (see Figure 7) or by opening the
Trace drop down menu. Saving in Thorlabs’ OSA file format, .spf2 / .spf2x, allows
for easy loading and post-processing using the OSA software. A variety of other
file formats are also available for export including .csv, .txt, .m, and more.
Figure 7 It is possible to save the data after a performed measurement in several
ways.
3.5. Functions and Appearance
3.5.1. Interferogram View vs Spectrum View
The OSA GUI can either display the interferogram or the spectrum. To switch
between the views, use the quick-switch button found in the Settings bar.
Regardless of which view that is displayed, data for both spectrum and
interferogram is still collected. Note that the Interferogram View is disabled for
Basic level users. Open the Settings dialog and switch to Advanced level for
access to interferograms.
For both views, only the analysis tools and math tools available for that particular
view (Spectrum or Interferogram) are enabled.
3.5.2. Using Markers
The movable markers (see Figure 8) can be moved by placing the mouse cursor
over the marker, where the mouse cursor changes into a double arrow. Press and
hold the left mouse button to drag the movable marker to the desired position.

 Loading...


