Resistance Charts
28
Resistance Charts
The Resistance Chart for all models is the same except the Total Gym
PowerTower is the only model that can accommodate all the levels shown.
The GTS has levels from F to 22 and the Sport has levels from F to 20. Level
F stands for “Fold” where the rails must be located to fold the Total Gym,
however it can also be used for exercise.
The Total Gym is designed to load nominal percentages of bodyweight as
shown to the left column for a 150 lb person. Note each level changes 2.5%
of the 150 lb nominal bodyweight. You can nd the resistance as a percentage
of bodyweight from the table below for you or your clients.
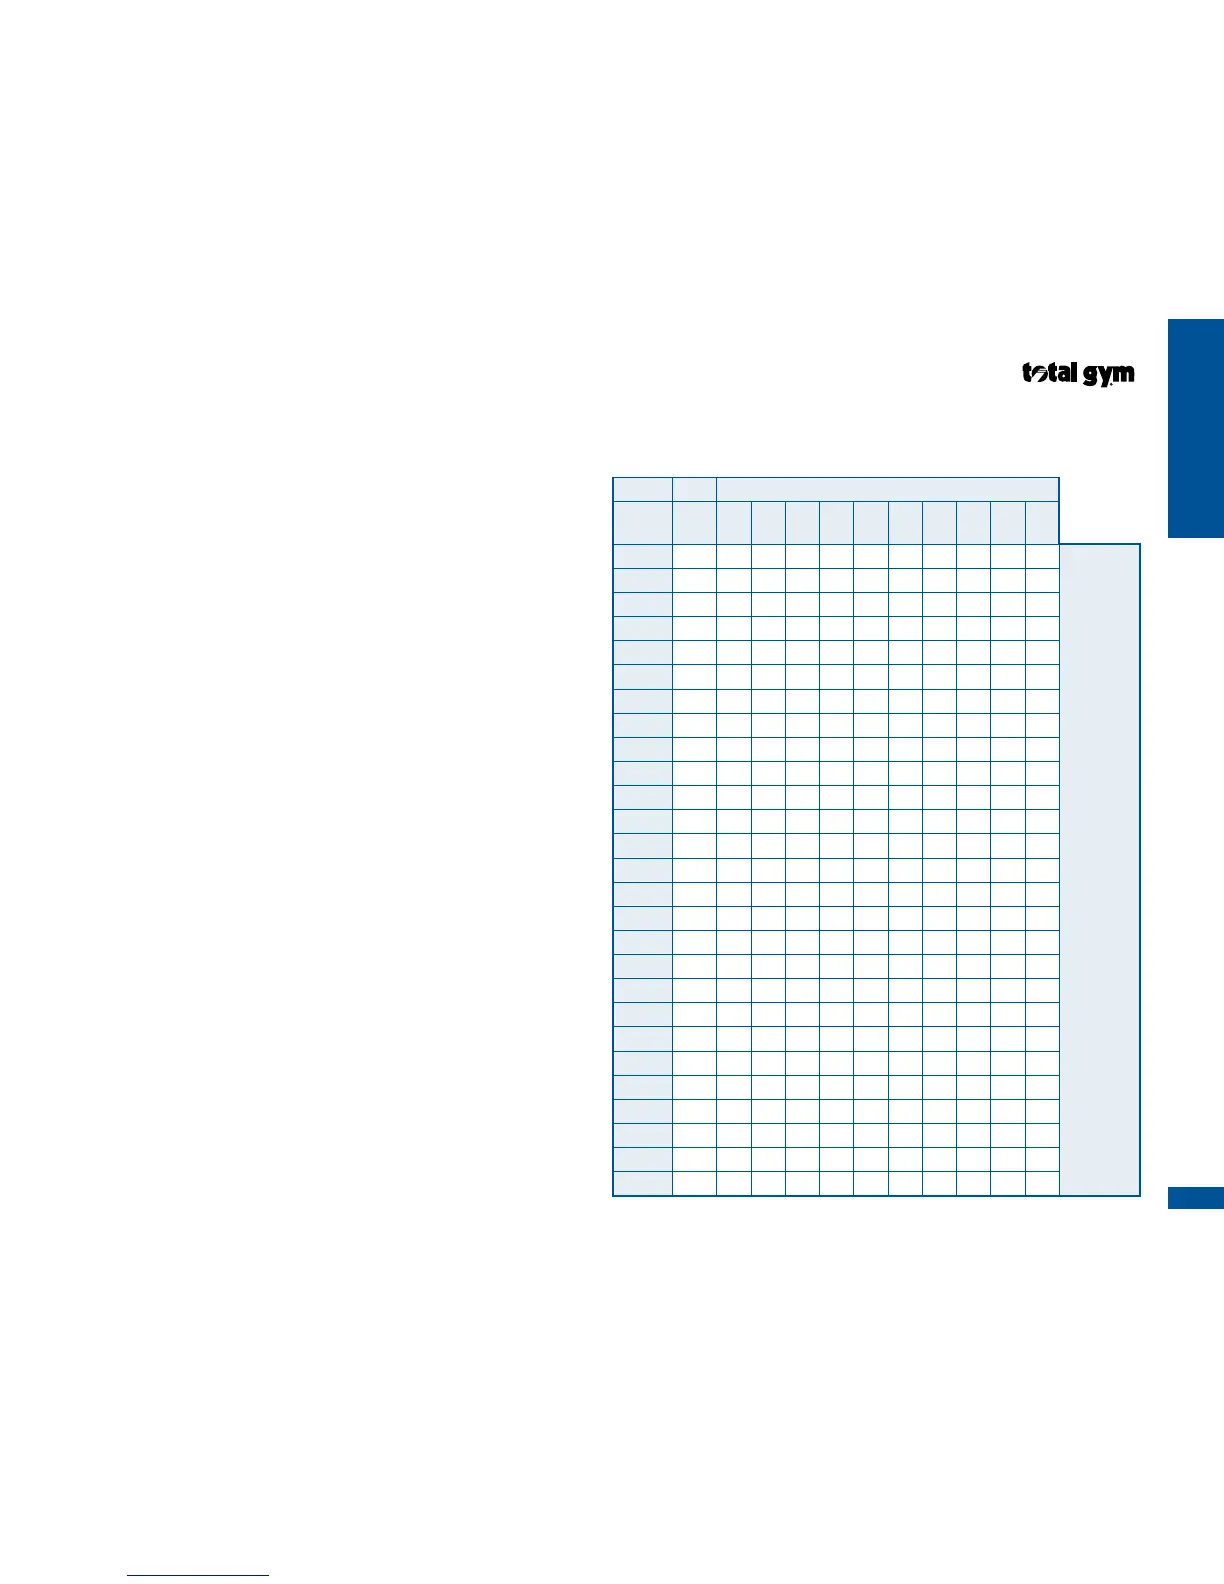
Resistance in Percentage of Bodyweight and Incline Level
Nominal Your Bodyweight + Weights Added
% of
BW Level 100 130 150 180 200 250 300 400 500 650
26 72 69 67 66 65 64 63 61 61 60
Max
Resistance
as % of
Bodyweight
65 25 69 66 65 63 63 61 60 59 59 58
24 68 65 63 62 61 60 59 58 57 57
60 23 65 62 61 59 59 57 57 56 55 54
22 62 60 58 57 56 55 54 53 53 52
55 21 60 57 56 54 54 53 52 51 50 50
20 57 54 53 52 51 50 50 49 48 48
50 19 54 52 51 50 49 48 47 46 46 45
18 52 49 48 47 47 46 45 44 44 43
45 17 49 47 46 45 44 43 43 42 41 41
16 46 44 43 42 42 41 40 39 39 39
40 15 43 42 41 40 39 38 38 37 37 36
14 41 39 38 37 37 36 36 35 34 34
35 13 38 36 36 35 34 34 33 33 32 32
12 35 34 33 32 32 31 31 30 30 30
30 11 33 31 31 30 30 29 28 28 28 27
10 30 29 28 27 27 27 26 26 25 25
25 9 27 26 26 25 25 24 24 23 23 23
8 25 24 23 23 22 22 21 21 21 21
20 7 22 21 21 20 20 19 19 19 19 18
6 19 18 18 18 17 17 17 17 16 16
15 5 17 16 16 15 15 15 15 14 14 14
4 14 13 13 13 13 12 12 12 12 12
10 3 11 11 11 10 10 10 10 10 10 9
2 9 8 8 8 8 8 8 7 7 7
5 1 6 6 6 5 5 5 5 5 5 5
F 3 3 3 3 3 2 2 2 2 2


 To Next Page