APPENDIX
Page
130
Copyright Trace Engineering Company, Inc.
5916 - 195th Street N. E.
Arlington, WA 98223
Telephone: 360/435-8826
Fax: 360/435-2229
www.traceengineering.com
SW Series Inverter/Charger
Part No. 2031-5
Rev. B: Sept 1, 1999
REFERENCE TABLES AND GRAPHS
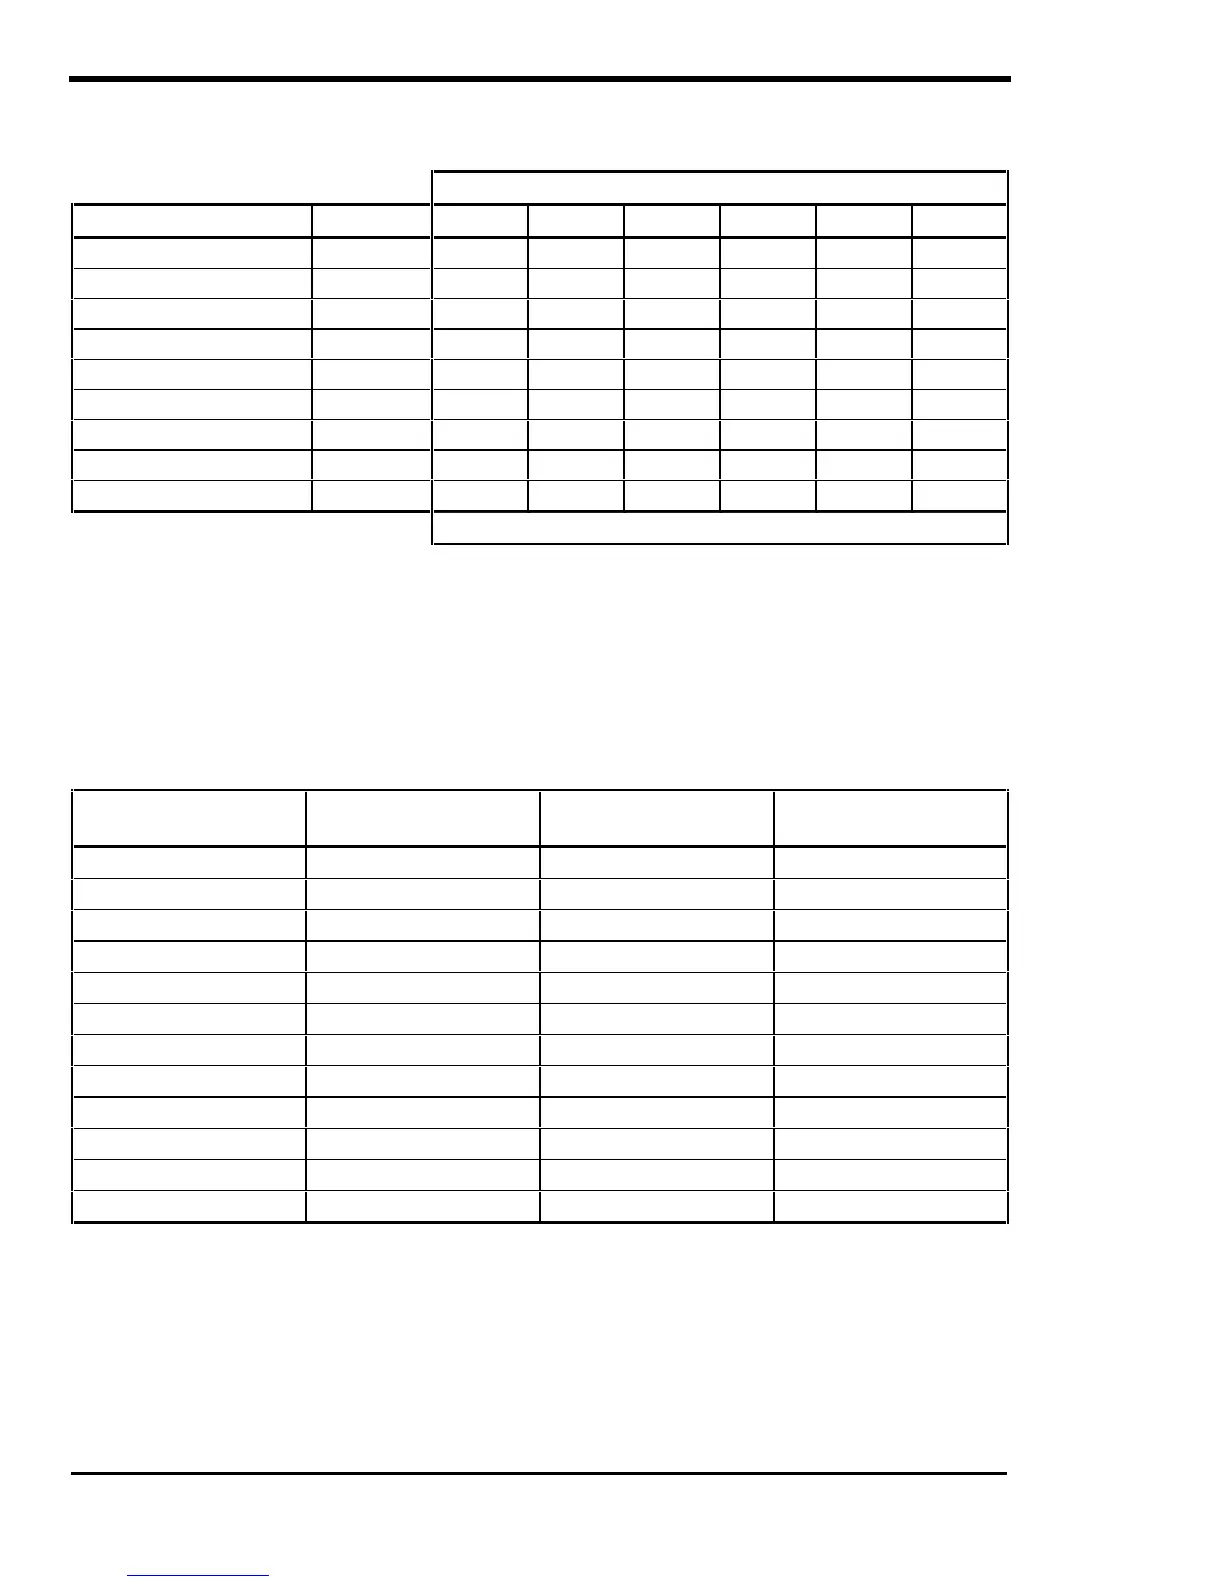
Table 9, Power Consumption Of Common Appliances
TIME IN MINUTES
APPLIANCE WATTS 5 15 30 60 120 240
Single PL Light 10 .1 .3 .7 1.3 2.7 5.3
B & W TV 50 .4124817
Computer 100 1 2 4 8 17 34
Color TV 200 2 4 8 17 34 67
Blender 400 3 8 17 34 67 133
Skil Saw 800 6 17 34 67 133 266
Toaster 1000 8 23 46 93 185 370
Microwave 1200 10 28 57 114 227 455
Hot Plate 1800 15 44 88 176 353 706
AMP-HOURS
If the current draw at 120 VAC is known, then the battery amperage at 12VDC will be 10 times the AC
amperage divided by the efficiency (90% in this table).
Motors are normally marked with their running rather than their starting current. Starting current can be
five times running current. Keep this in mind when sizing a motor into a system.
Refrigerators and icemakers typically run about 1/3 of the time. Therefore, their average battery current
draw is 1/3 what their amp rating would indicate.
Table 10, AWG to Metric Wire Conversion Chart
AWG DIAMETER/MM AREA/MM²
DC RESISTANCE
1000 FT
14
1.63 2.08 3.14
12
2.05 3.31 1.98
10
2.59 5.27 1.24
8
3.26 8.35 0.778
6
4.11 13.3 0.491
4
5.19 21.2 0.308
2
6.54 33.6 0.194
1
7.35 42.4 0.154
0 (1/0)
8.25 53.4 0.122
00 (2/0)
9.27 67.5 0.0967
000 (3/0)
10.40 85.0 0.0766
0000 (4/0)
11.68 107.2 0.0608
Note: Stranded wire sizes and ampacity for 75°C.
 Loading...