14 88-A4HP4001-1G-EN
Table 14.2
8 9 10 11 12 13 14
55
179 182 185 188 191 195 198
60
195 198 201 204 208 211 215
65
211 215 218 222 225 229 232
70
229 232 236 240 243 247 251
75
247 251 255 259 263 267 271
80
267 271 275 279 283 287 291
85
287 291 296 300 304 309 313
90
309313318322327331336
95
331 336 341 346 351 355 360
100
355360365370376381386
105
381 386 391 396 402 407 413
110
407 413 418 424 429 435 441
115
435 441 446 452 458 464 470
120
464470476482488495501
125
495 501 507 514 520 527 533
R-410A REFRIGERANT CHARGING CHART
LIQUID
TEMP
(
°
F)
FINAL
SUBCOOLING (
°
F)
LIQUID GAGE PRESSURE (PSI)
From Dwg. D154557P01 Rev. 3
STEP 6 - Adjust refrigerant level to attain proper gage pressure.
Add refrigerant if the Liquid Gage Pressure is lower than the chart value.
1. Connect gages to refrigerant bottle and unit as illustrated.
2. Purge all hoses.
3. Open bottle.
4. Stop adding refrigerant when liquid line temperature and Liquid Gage Pressure matches the charging chart
Final Subcooling value.
Recover refrigerant if the Liquid Gage Pressure is higher than the chart value.
STEP 7 - Stabilize the system.
1. Wait 20 minutes for the system condition to stabilize between adjustments.
Note: When the Liquid Line Temperature and Gage Pressure approximately match the chart, the system
is properly charged.
2. Remove gages.
3. Replace service port caps to prevent leaks. Tighten finger tight plus an additional 1/6 turn.
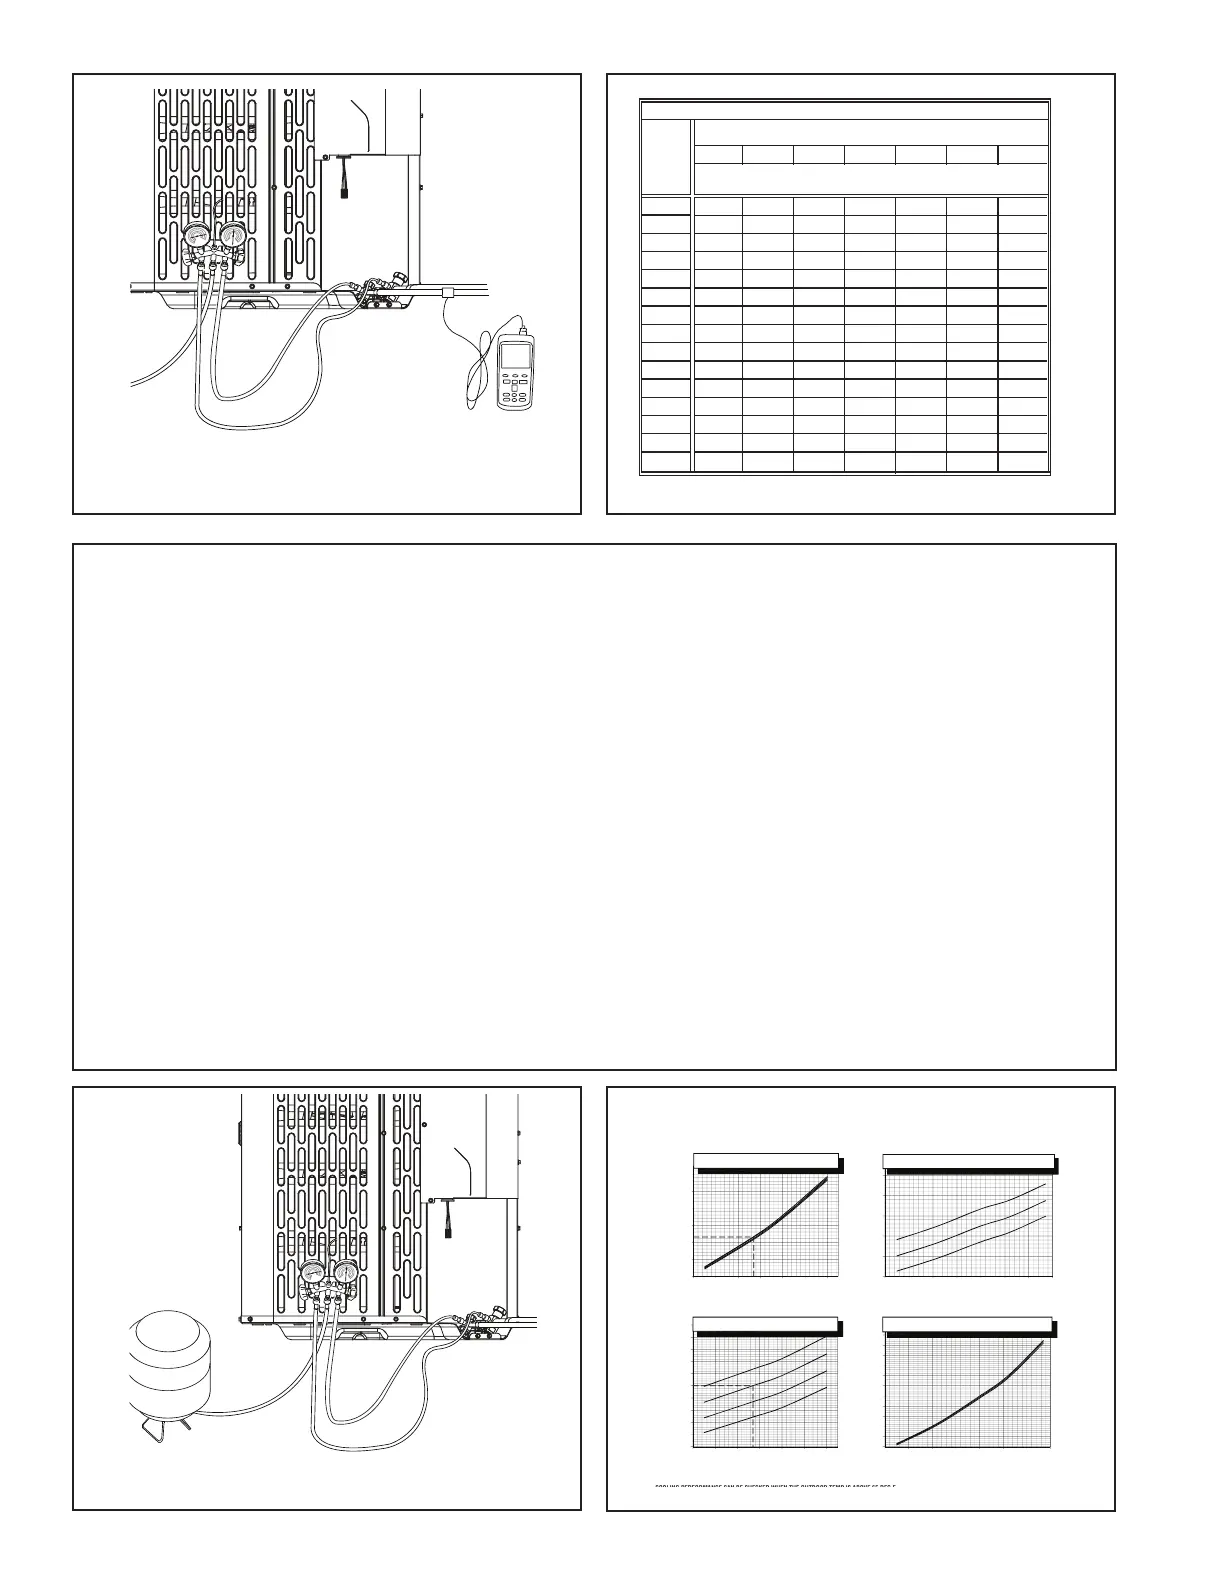
STEP 8 - Verify typical performance.
Refer to System Pressure Curves in this document to verify typical performance.
(Example only)
TAM4A0A36S31 TAM4A0A36S31
Cooling Heating
DISCHARGE PRESSURE (PSIG)
OUTDOOR TEMPERATURE (Degree F)
SUCTION PRESSURE (PSIG)
OUTDOOR TEMPERATURE (Degree F)
COOLING PERFORMANCE CAN BE CHECKED WHEN THE OUTDOOR TEMP IS ABOVE 65 DEG F
(2)
(5) (3)
(1)
110
115
120
125
130
135
140
145
150
155
160
55 65 75 85 95 105 115
(2)
(4) (3)
(1)
200
250
300
350
400
450
500
55 65 75 85 95 105 115
INDOOR ENTERING WET BULB CURVES TOP TO BOTTOM 71,
67, 63 AND 59 DEG F.
INDOOR ENTERING W ET BULB CURVES TOP TO BOTTOM
71, 67, 63 AND 59 DEG F.
40
50
60
70
80
90
100
110
120
130
140
150
160
-5 5 152535455565
250
300
350
400
450
500
-5 5 152535455565
INDOOR ENTERING DRY BULB CURVES TOP TO BOTTOM 80, 70, AND 60
DEG F.
INDOOR ENTERING DRY BULB CURVESTOP TO BOTTOM 80, 70, AND
60 DEG F.
107 °F