32 BAS-SVX40B-EN
Appendix: Using the Tracer™ TU Service Tool with Wireless Networks
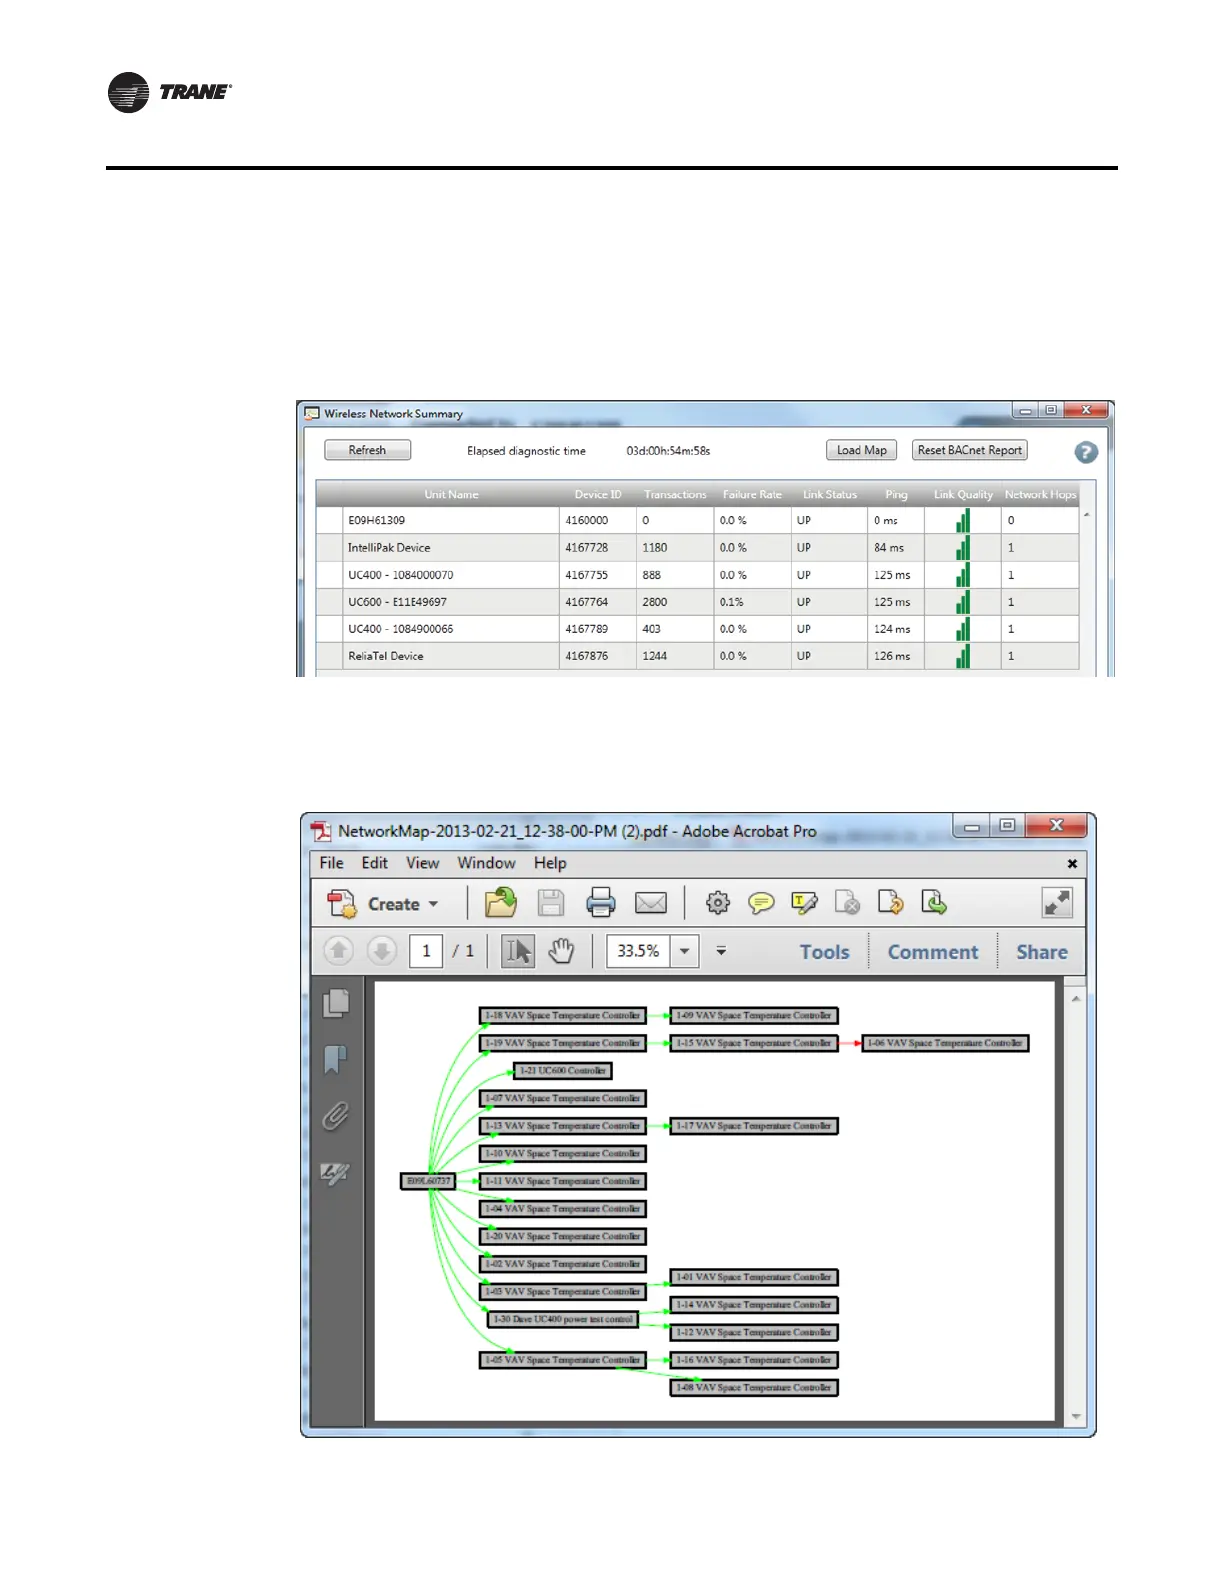
• Link status and signal quality
• The amount of time it took forTracer SC to get a response to a comm request from each device
(You can also access the Wireless Network Summary Report by clicking Report on the Network
Devices tab.)
Figure 20. Wireless Network Summary Report
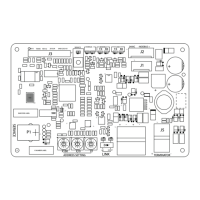
Click Load Map to view a graphical representation or “map” of the network showing its structure
and signal strength. Figure 21 shows an example of a network map.
Figure 21. Network Map