Rebar Scanner A60+
21
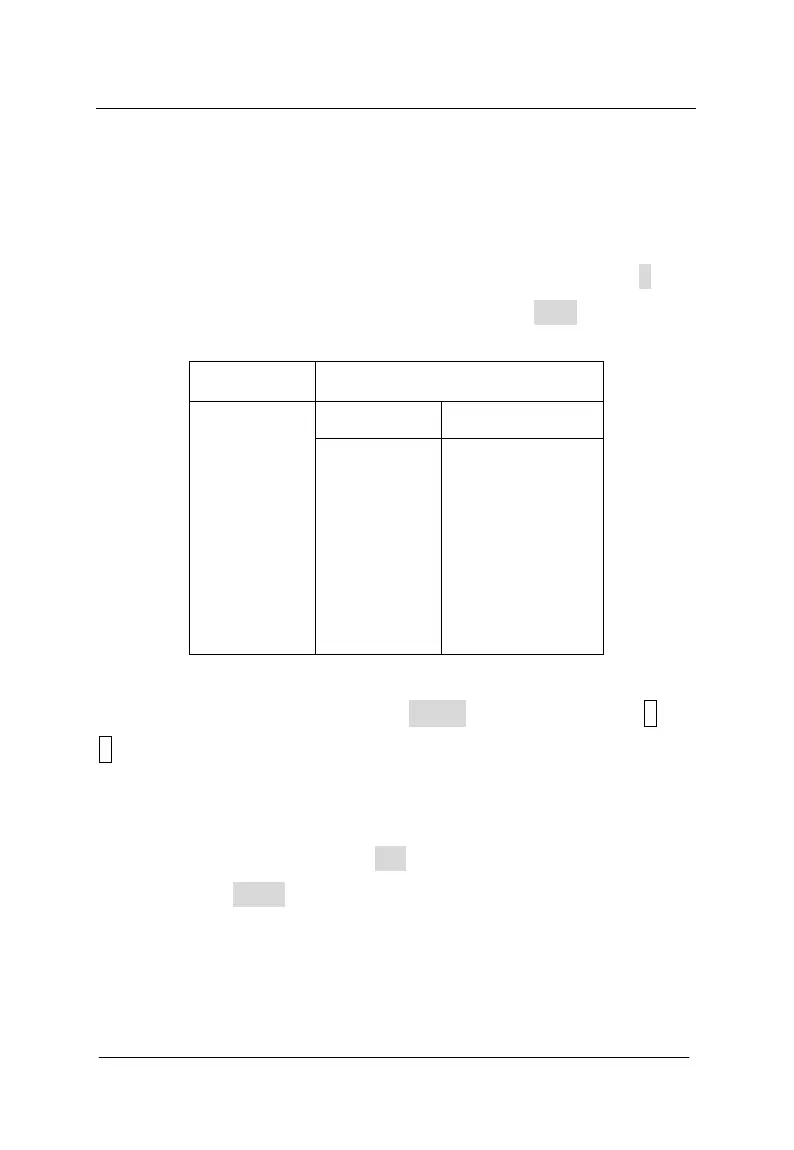
that is to say, interface of viewing diameter as figure 3-18 shows,
saved rebar diameter and covering layer thickness of this project are
showed in right data region. Rebar diameter corresponds to covering
layer thickness one by one. By following coincidence relation of
geometric location, that is to say, the first data of No. line in T data
column corresponds to the first data of No, line in Dia. data column.
The second data in the same line is also corresponding.
No. Data(mm)
T Dia. 1002
1005
=> 2003
3001
4001
4003
3002
23 23
22 23
12 12
10 12
Figure 3-18 interface of viewing diameter
When project No. begun with 3XXX is selected through ↑ and
↓keys, that is to say, interface of viewing data of grid pattern scan as
figure 3-19 shown. Saved rebar diameter, covering layer thickness and
the distance that rebar is relative to the zero point in this project are
showed in right data region. NO indicates the serial number of
detected rebar. XΦ16 indicates preset diameter of longitudinal rebar
for this project No., which corresponds to following data including
data of detecting covering layer thickness of longitudinal rebar in the
first line and the distance that this rebar is relative to the zero point in