25
© Vallox Oy - All rights reserved
USING THE UNIT
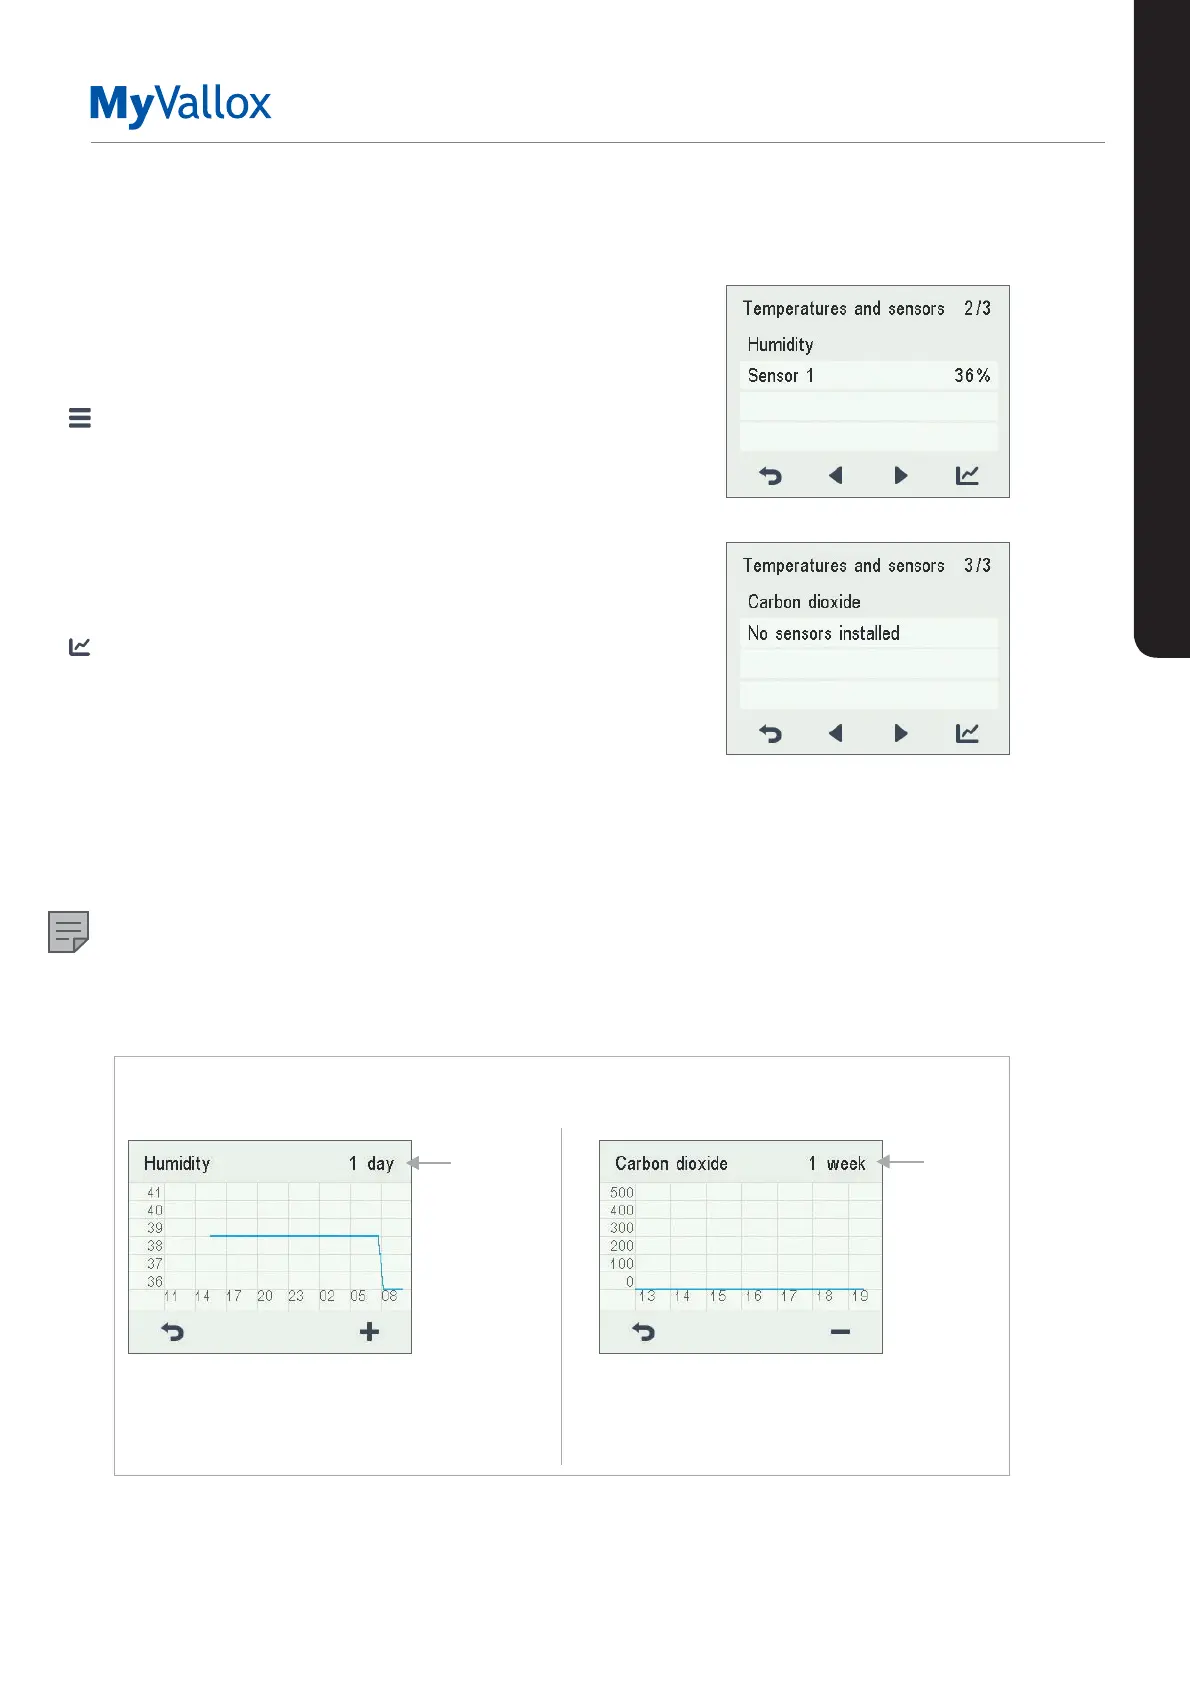
Viewing the relative humidity of air and
carbon dioxide levels measured by the
sensors
To browse levels measured by individual sensors:
1. Select Settings > Temperatures and sensors.
2. Select OK.
3. Use the arrow buttons to switch from the summary
display of Temperatures and sensors to view the relative
humidity of air and carbon dioxide levels measured by
the humidity and carbon dioxide sensors.
To browse statistics for relative humidity of air and carbon
dioxide levels:
1. Select Statistics next to the sensor group you wish to
view.
2. A graph opens on the display showing the relative
humidity of air and carbon dioxide levels recorded over
the past 24 hours by the sensor with the highest values.
3. Use the Plus and Minus buttons to alternate between
weekly and daily statistics.
4. To exit the menu, press the Back button.
NOTE
For more detailed instructions, go to
www.vallox.com
Relative humidity of air statistics for the past 24 hours.
You can view the graph for a week or for a single day.
Carbon dioxide level statistics for the past week.
You can view the graph for a week or for a single
day.
1 day
1 week
Relative humidity of air and carbon dioxide level statistics
1 day
1 week
TEMPERATURES AND SENSORS