November 5, 2015 6/10
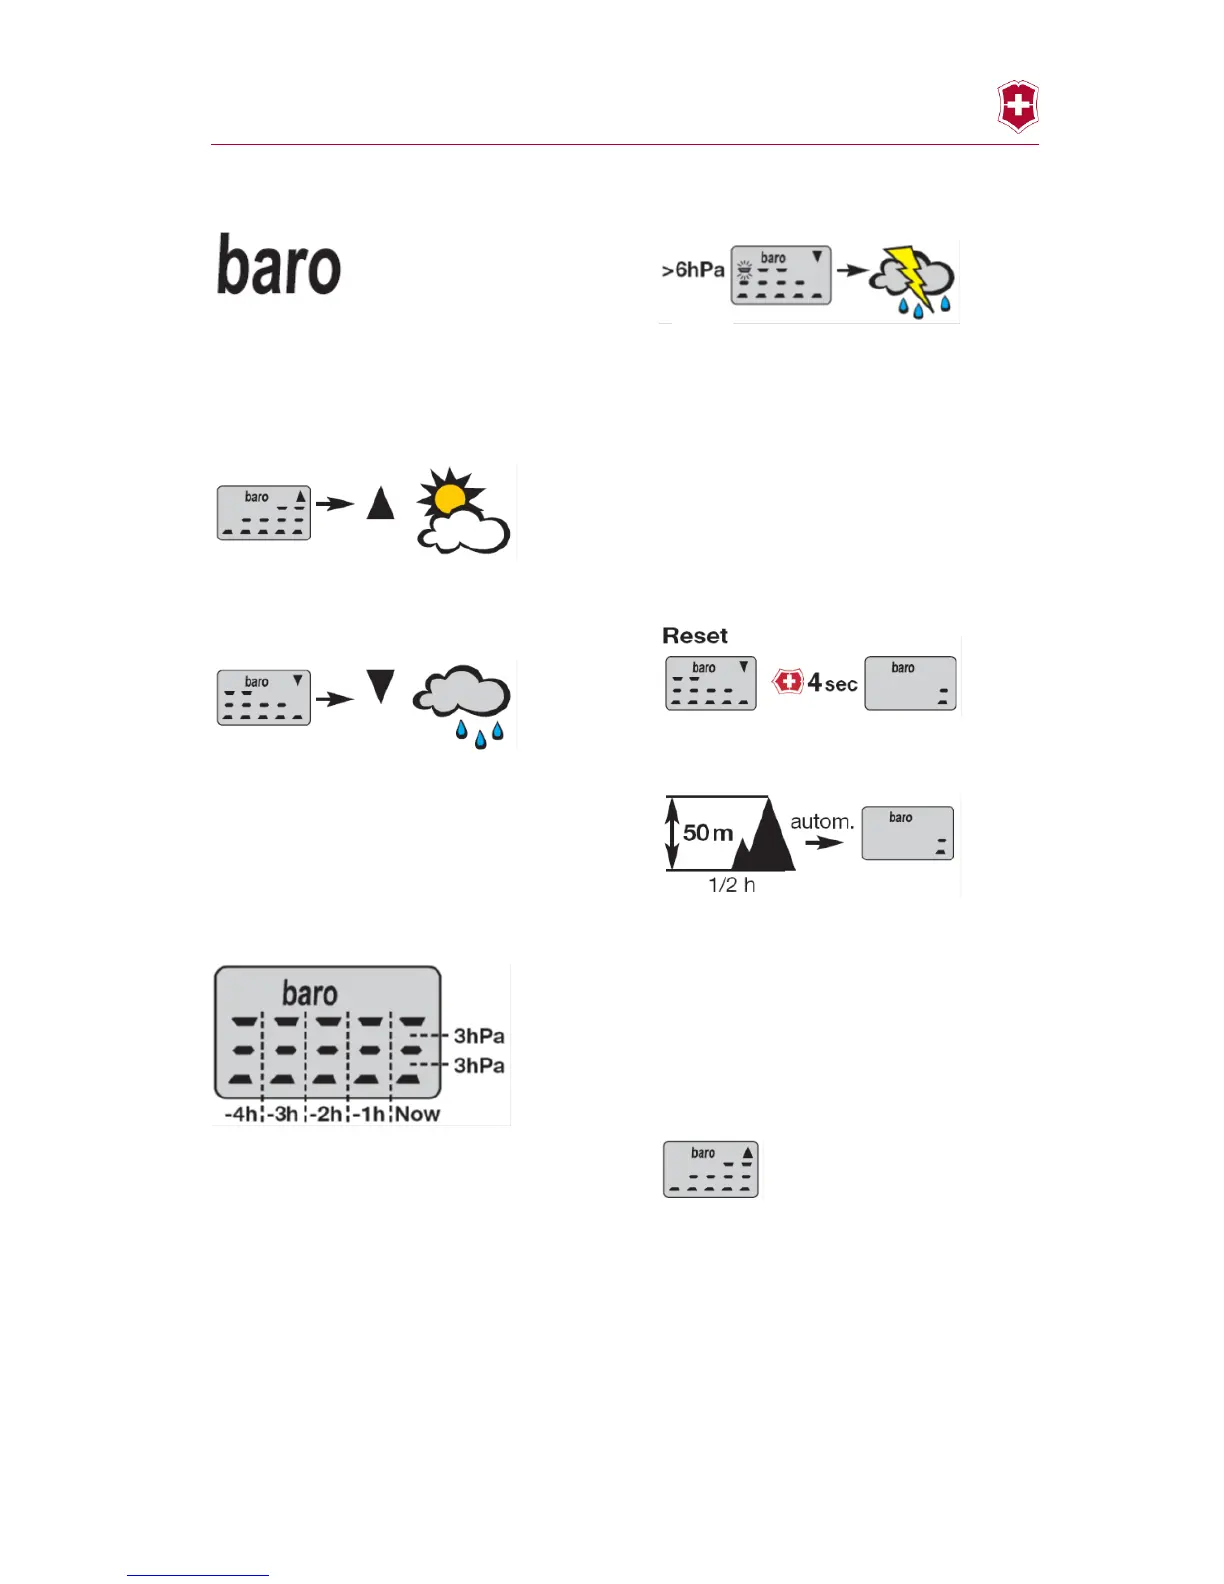
Barometer indicator
Reference to changing air pressure at the
same site enables weather forecasts to be
made. If the air pressure rises, the weather
can be expected to improve; if the air pres-
sure falls, the weather is worsening.
If the chart is rising from left to right, the air
pressure has risen and the weather can be
expected to improve.
If the chart is falling, the weather can be ex-
pected to deteriorate.
If the chart remains stable, the weather is
constant.
The bar chart in the main barometer menu
displays the air pressure trend for the past
4 hours and therefore enables a weather
fore-cast to be made. The chart compares
the air pressure values measured 4, 3, 2 and
1 hour previously with the present value. One
bar height is equivalent to 3 hPa (3 mbar).
If the difference over a 4 hour period is
greater than 7hPa, the segments which ex-
tend beyond the range of 6hPa begin to
flash. This is a clear indication that the air
pressure is changing fast. If this happens
with falling air pressure, a severe weather
deterioration or even a storm, must be ex-
pected.
Barometer display reset
Press the Victorinox emblem for 4 seconds to
reset the display.
If the difference between two measured val-
ues is too great, the barometer is automati-
cally reset. This is equivalent to an altitude
difference of 50 m within thirty minutes. The
assumption is that the position rather than
the weather has changed.
Significance of the arrow
The arrow shows the barometer trend. If the
arrow points upwards, the air pressure is
tending to rise. If the arrow points down-
wards, the air pressure is tending to fall. The
arrow shows whether the air pressure
change is persistent. If the change is only a
fluctuation, the arrow does not appear.
 Loading...