38 39
Days
mg/dL
Days
mg/dL
Days
mg/dL
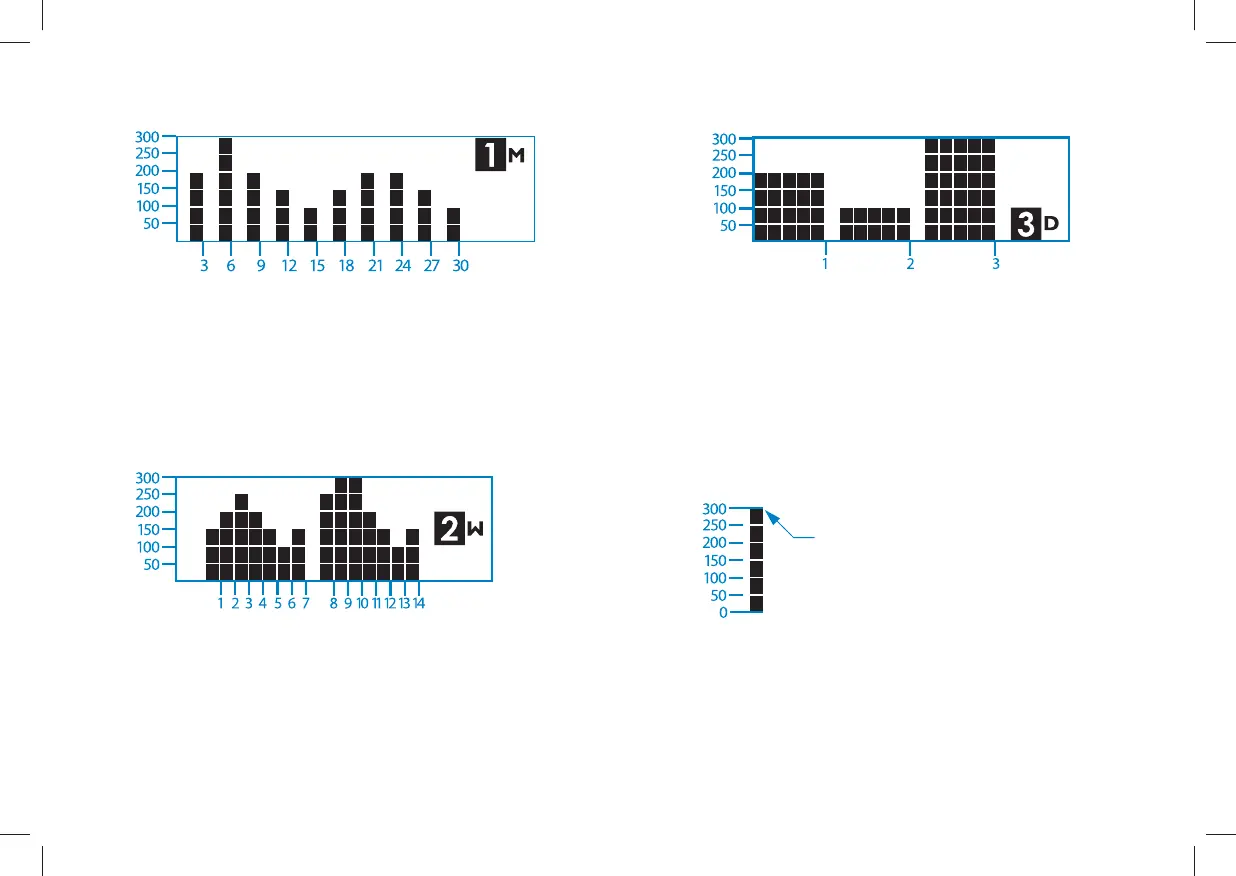
1 Month Trend Graph: 3 Day Trend Graph:
2 Week Trend Graph:
Each bar represents a test result average from 3 days. Each
vertical unit represents 50 mg/dL. The most recent result is
on the right side of the screen.
Each bar represents a test result average from 1 day. Each
vertical unit represents 50 mg/dL. The most recent result is
on the right side of the screen.
Each bar represents a test result average from 1 day. Each
vertical unit represents 50 mg/dL. The most recent result is
on the right side of the screen.
IMPORTANT: Averages above 300 mg/dL will not be
represented in the trend graphs.
mg/dL
Any bars represented at 300 mg/dL may
represent a value higher than 300 mg/dL.