23
Operation Method
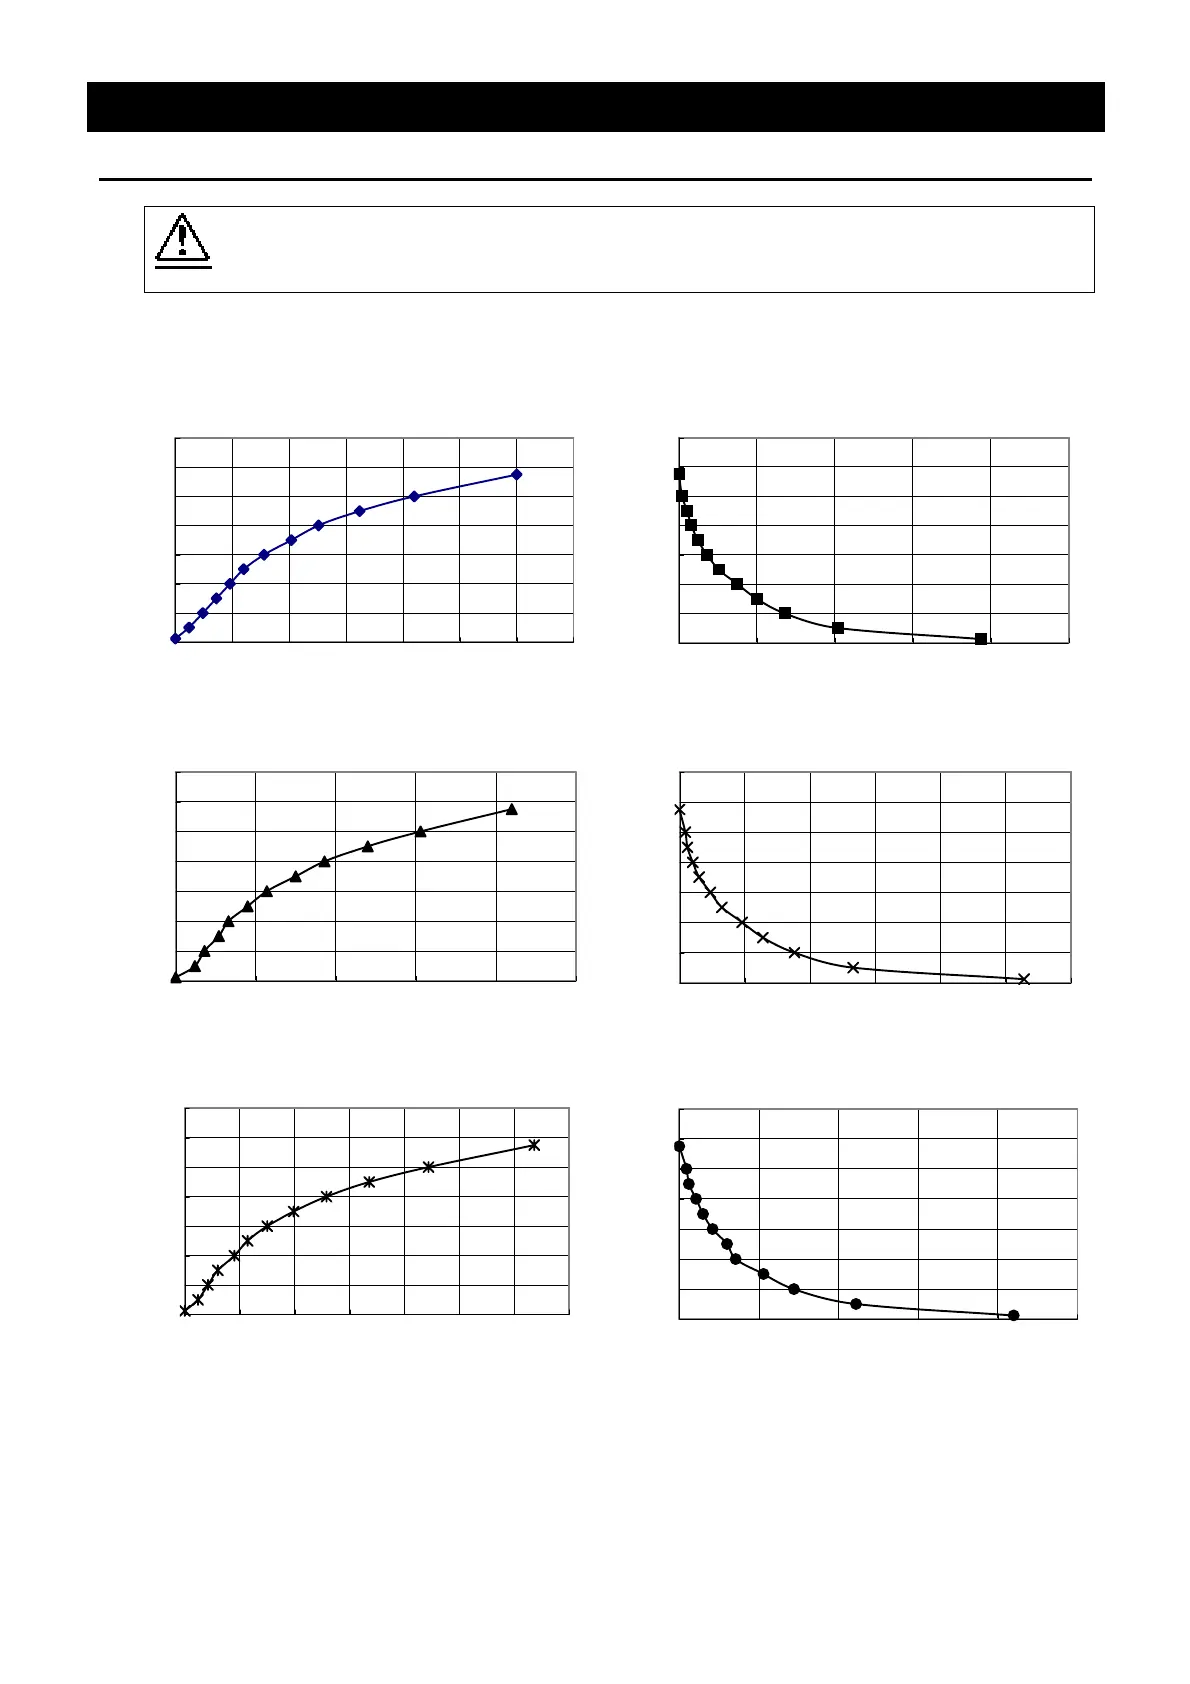
Temperature Rise/Fall Curve (Reference)
The following graph shows the data for temperature rise/fall of respective device types.
The data shown is only reference because these values vary depending on the quantity of
sample or an ambient temperature.
Use the data for temperature rise/fall when programming.
Temperature rising characteristics in FO100
0
200
400
600
800
1000
1200
1400
0 5 10 15 20 25 30 35
Temperature falling characteristics in FO100
0
200
400
600
800
1000
1200
1400
0 100 200 300 400 500
Temperature rising characteristics in FO200
0
200
400
600
800
1000
1200
1400
0 1020304050
Temperature falling characteristics in FO200
0
200
400
600
800
1000
1200
1400
0 100 200 300 400 500 600
Temperature rising characteristics in FO300
0
200
400
600
800
1000
1200
1400
0 10203040506070
Temperature falling characteristics in FO300
0
200
400
600
800
1000
1200
1400
0 100 200 300 400 500
Time (min.)
Tem
erature
℃
Time (min.)
Tem
erature
℃
Time (min.)
Tem
erature
℃
Time (min.)
Tem
erature
℃
Time (min.)
Tem
erature
℃
Time (min.)
Tem
erature
℃