5-23
IM 04L42B01-01E
Operations for Changing the Displayed Contents
5
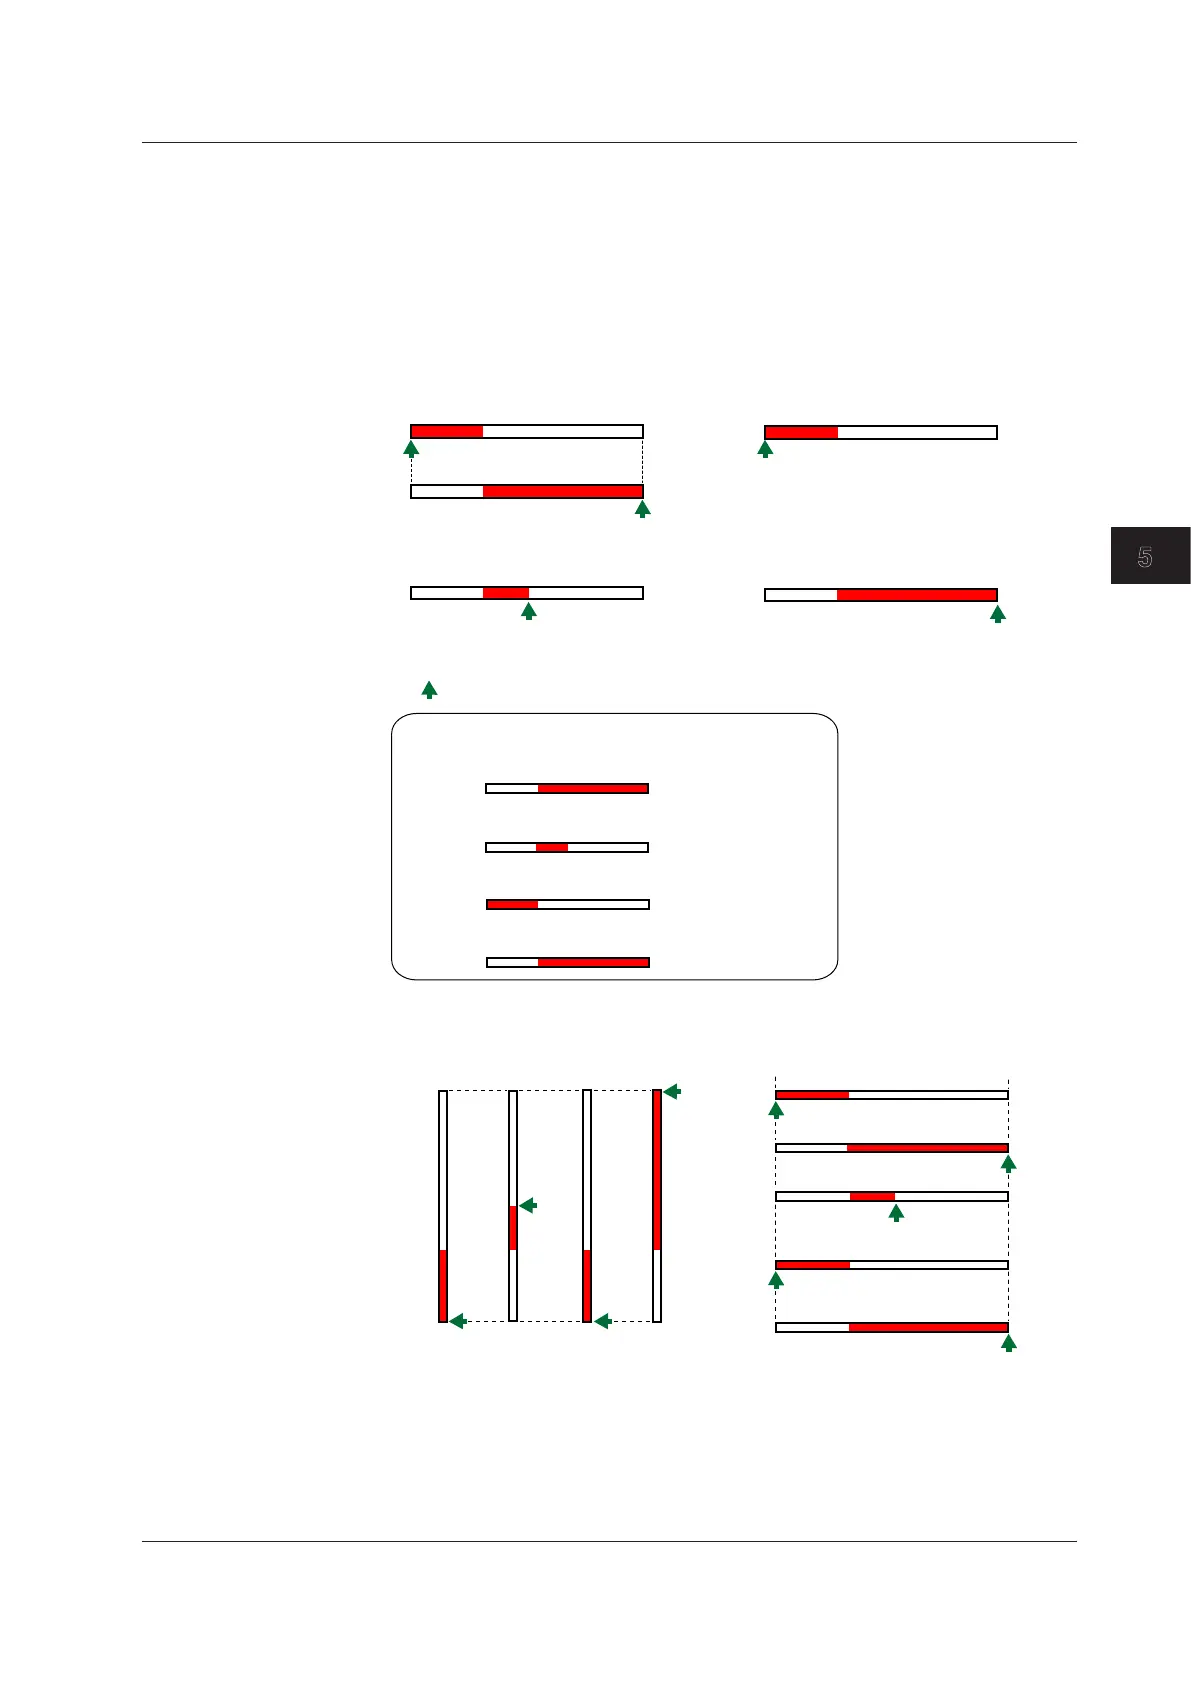
WhentheDisplayDirectionoftheBarGraphIsHorizontal
The span lower limit (or scale lower limit) becomes the left edge of the bar graph, and the
span upper limit (or scale upper limit) becomes the right edge of the bar graph.
• Startingpointofthebar
Normal: Left edge or right edge, whichever is less
Center: Center
Lower: Left edge
Upper: Right edge
Center
Upper
V
lower
(V
lower
< V
upper
)
(V
lower
> V
upper
)
V
upper
V
lower
V
upper
V
lower
V
V
lower
V
Vupper: Span upper limit (or scale upper limit)
Vlower: Span lower limit (or scale lower limit)
: Starting point of the bar
^?^?
Center
Normal
Upper
Lower
0.0
–100.0
0.0
–100.0
0.0
–100.0
0.0
–100.0
Example: When the span lower and upper limits of the input
range are 0.0 and –100.0, respectively
WhenDisplayingtheCurrentValueontheScaleUsingtheBarGraph
(V
lower
< V
upper
)
Center
Normal
Upper
Lower
lower
(V
lower
> V
upper
)
Normal
Center
Lower Upper
V
lower
upper
• Bargraph>Division
Select the number of main scale marks from 4 to 12.
5.11ChangingtheBarGraphDisplayMethod
 Loading...