1-16
IM 04L42B01-01E
BarGraphDisplay
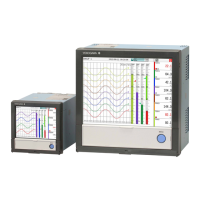
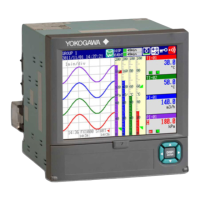
Waveform data is displayed in a bar graph. For the operating procedure, see section 4.2.
Horizontal
Alarm point mark
Scale
Bar graph (displayed using the
channel display color)
Measured value
Lower limit of span and unit
Upper limit of span
Tag or channel number
Alarm mark
Bar graph base position is set
to Normal, Lower*, or Upper*.
* You can select Lower and Upper
on DXs with release number 2 or
later.
Bar graph base position is set
to Center
See section 5.7.
See section 5.11.
See section 5.10.
See section 5.11.
Bar graph base position is set to Center
See section 5.11.
See section 5.11.
• UpdatingoftheBarGraph
The bar graph is updated at the same interval as numeric values.
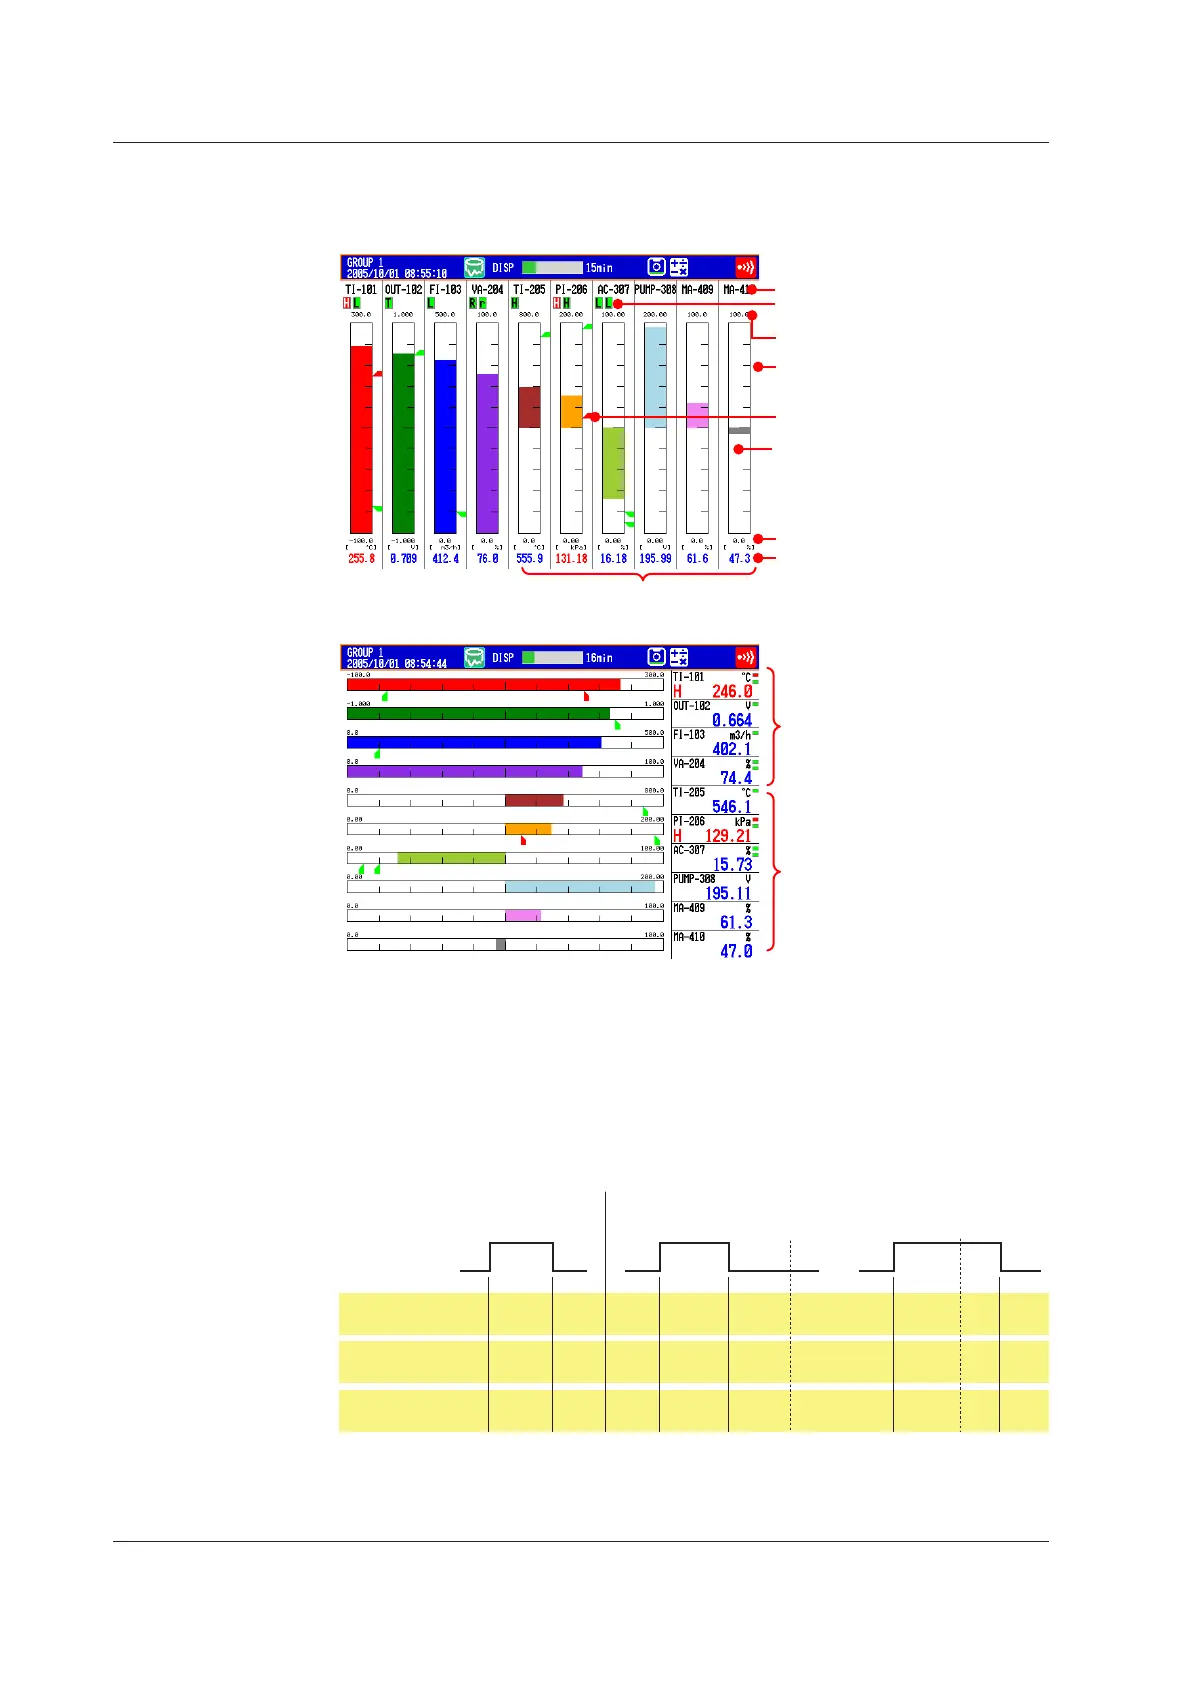
• AlarmIndication
Alarm mark, alarm point mark, and measured value are displayed as follows according
to the alarm status. When you use the alarm annunciator function (release number 3
or later), the alarm marks and alarm point marks follow the annunciator sequence.
Alarm
Release
Red Green Red
Green Red RedGreen Green Green Green Green
Alarm ACK Alarm ACK
Occurrence
set to non-hold
set to hold
Point mark
Red Blue Red
Blue Red RedBlue
Blue
Blue Blue Blue
Measured
Blinking
red
Blinking
green
Blinking
red
Green Red RedGreen Green GreenGreen Green
Alarm mark
1.3Display
 Loading...