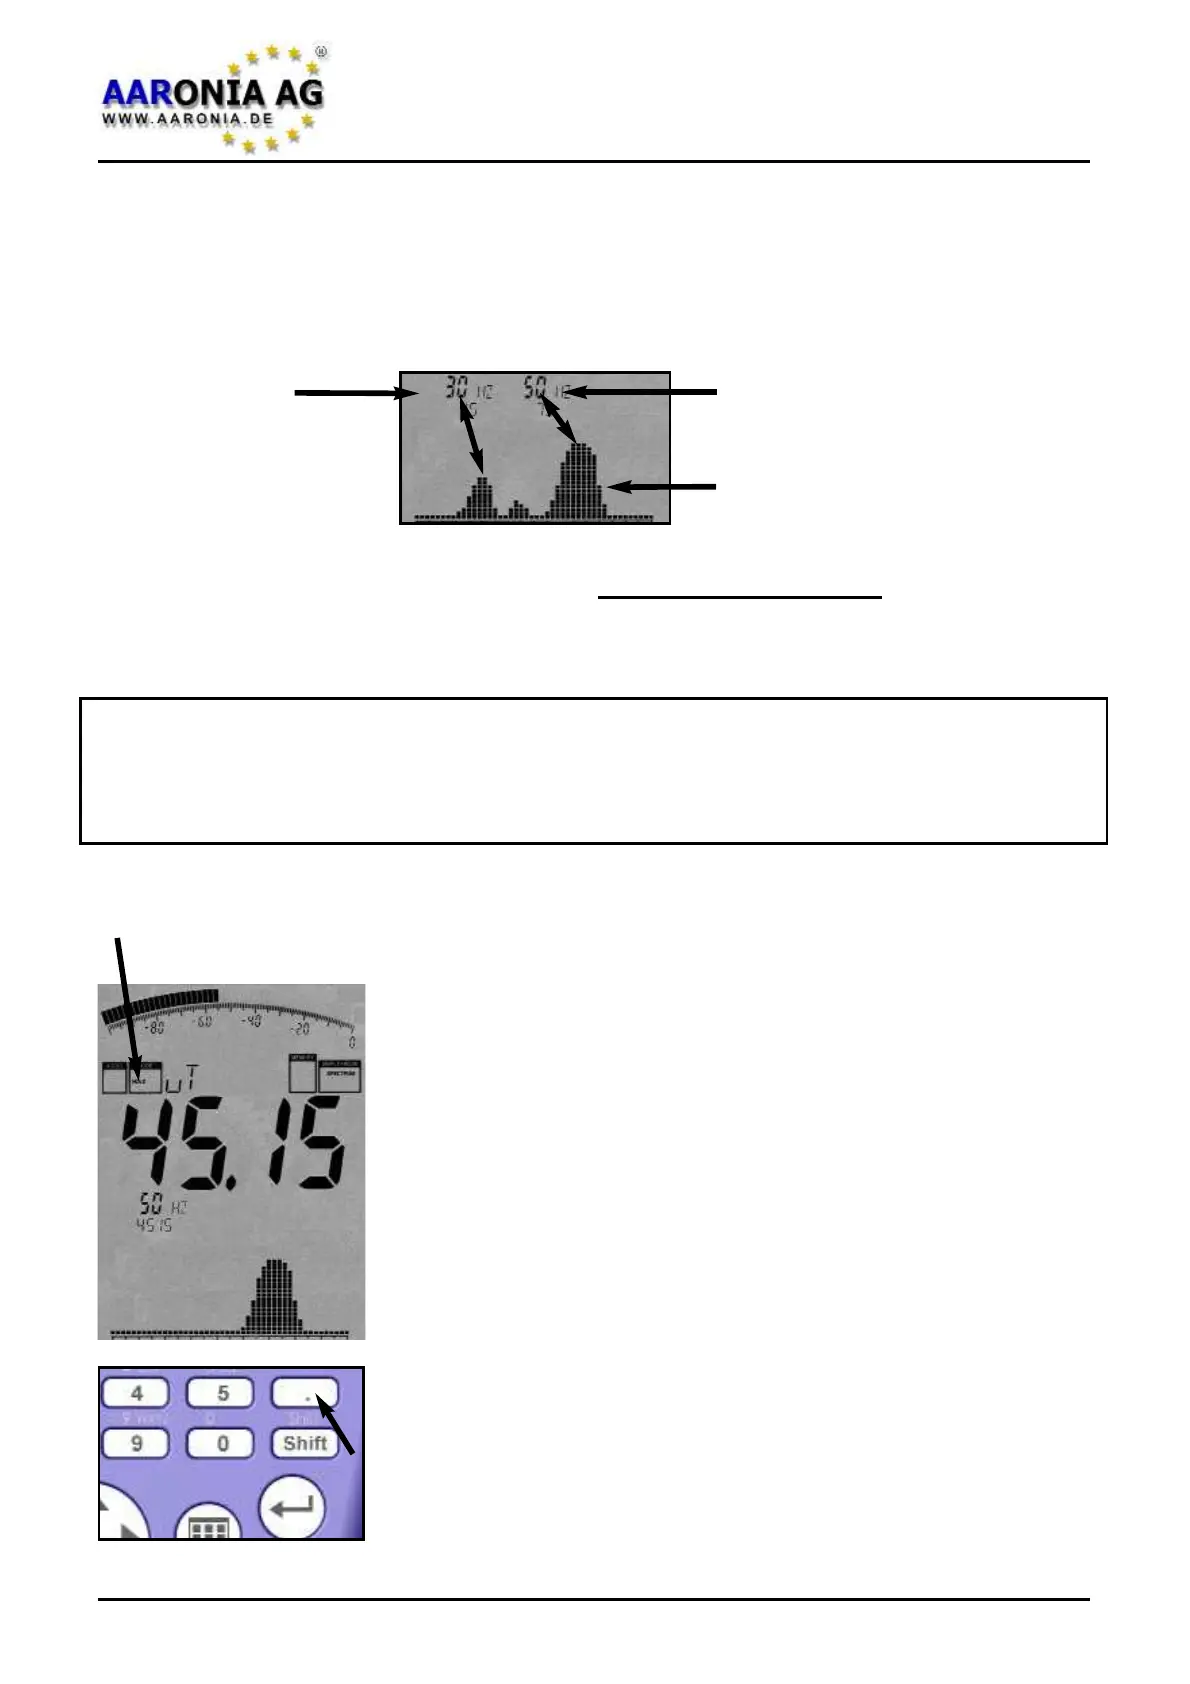
Directly below up to 3 so-called “markers” are displayed. These show the fre-
quency and corresponding signal strength of the strongest signal sources. In our
example, we have two markers. Marker1 at 30Hz and 45µT and marker2 at
50Hz and 75µT (75µT is at the same time the strongest signal overall, that’s why
it is also displayed on the main display).
Below the markers, the graphics display shows a graphic consisting of a num-
ber of little “hills“. This graphic is called “SPECTRUM DISPLAY“. The higher the
“hills“, the stronger the corresponding signal. The markers mentioned previous-
ly show the frequency and level at the peaks of each “hill“.
Using frequency charts, it is also possible to make assumptions on the origin or
source of the corresponding signal. See our frequency charts on page 56 for
more details. Please note that marker-frequencys are always shown with one
decimal place.
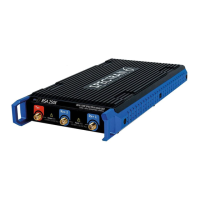
5.4 HOLD mode
(The MODE status field displays “HOLD”)
As you have probably already noticed, the display chan-
ges constantly. This is completely normal as the field
strength also changes with distance to the signal sour-
ce. Simply try it out yourself - move the device around the
signal source and keep an eye on the display and the
changing readouts.
Often, the user just wants to check the highest possible
readout. However, as the display always keeps chan-
ging, this might cause difficulties. To solve these pro-
blems you can use the so-called HOLD mode. To activa-
te it, press the dot key. The
mode status field will display
“HOLD”. From now on, only the strongest measured sig-
nal will be displayed. Furthermore, the spectrum display
will not be erased - it seems to literally “freeze“. By pres-
sing the dot key a second time, “HOLD“ will disappear
from the MODE status field and HOLD mode is turned off.
Marker1
30Hz
45µT
Marker2
50Hz
75µT
Graphical display
with SPECTRUM graph
5.0 Your first measurement / Modes
Firmware V 1.0 / © 2005-2013 by Aaronia AG, D-54597 Euscheid, www.aaronia.com
12