Not that difficult, either. Finally, we represent the strength of each signal in terms
of vertical bars with corresponding heights along the Y axis:
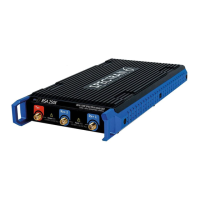
In addition, we have made the markers as wide as the frequency range of each
application (the so-called bandwidth): our unknown signal occupied the fre-
quency range from 350 to 360Hz - accordingly, its bandwidth was 10Hz
(360-350Hz = 10Hz).
Well, it was all quite simple at the end, wasn’t it? We now have a single display
consisting of ALL information available about the three signal sources.
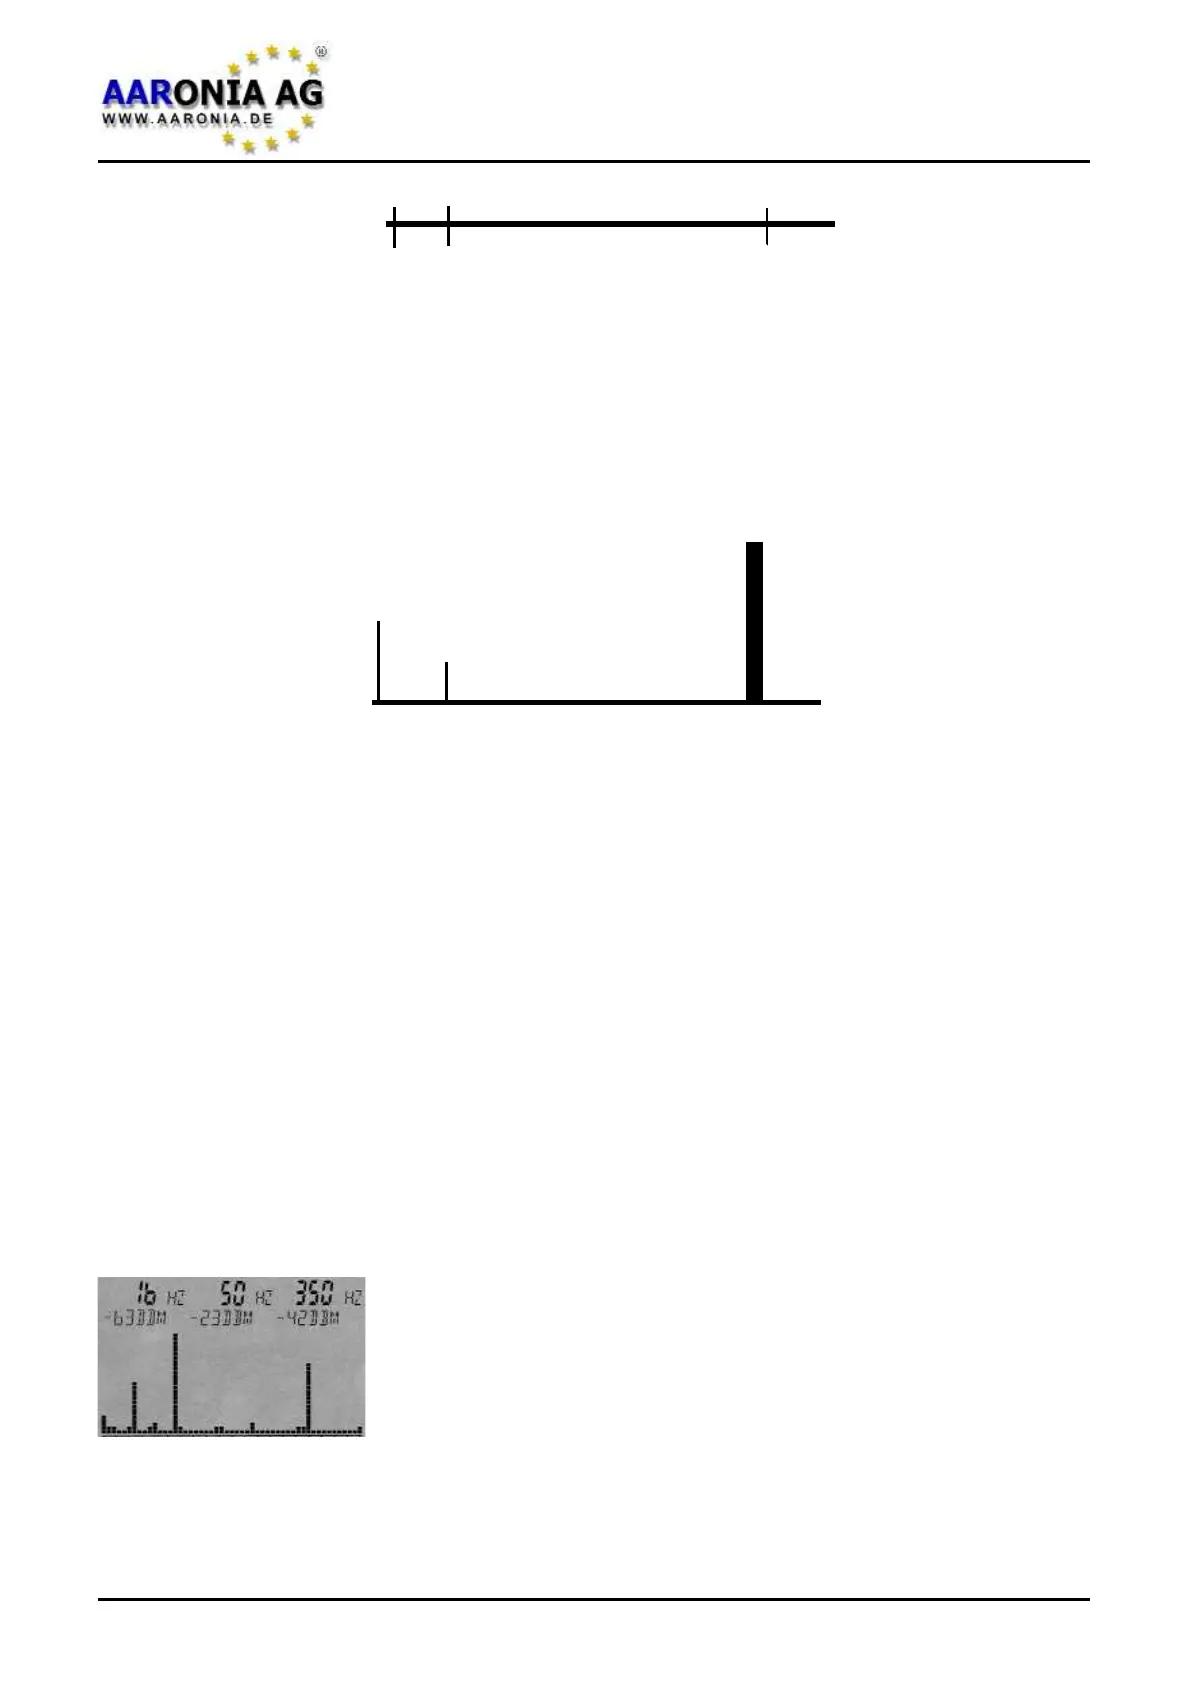
In practice, this display could look similar to the following image on an idealized
measurement device:
This example image also shows 3 main signal sources,
from left to right:
Signal #1=16.7Hz at -63dBm
Signal #2=50Hz at -23dBm
Signal #3=350Hz at -42dBm
0Hz
400Hz
16.7Hz
50Hz
350-360Hz
Firmware V 1.0 / © 2005-2013 by Aaronia AG, D-54597 Euscheid, www.aaronia.com
60
0Hz
400Hz
16.7Hz
50Hz
350-360Hz
40
20
80
19.0 Spectrum analysis basics
 Loading...