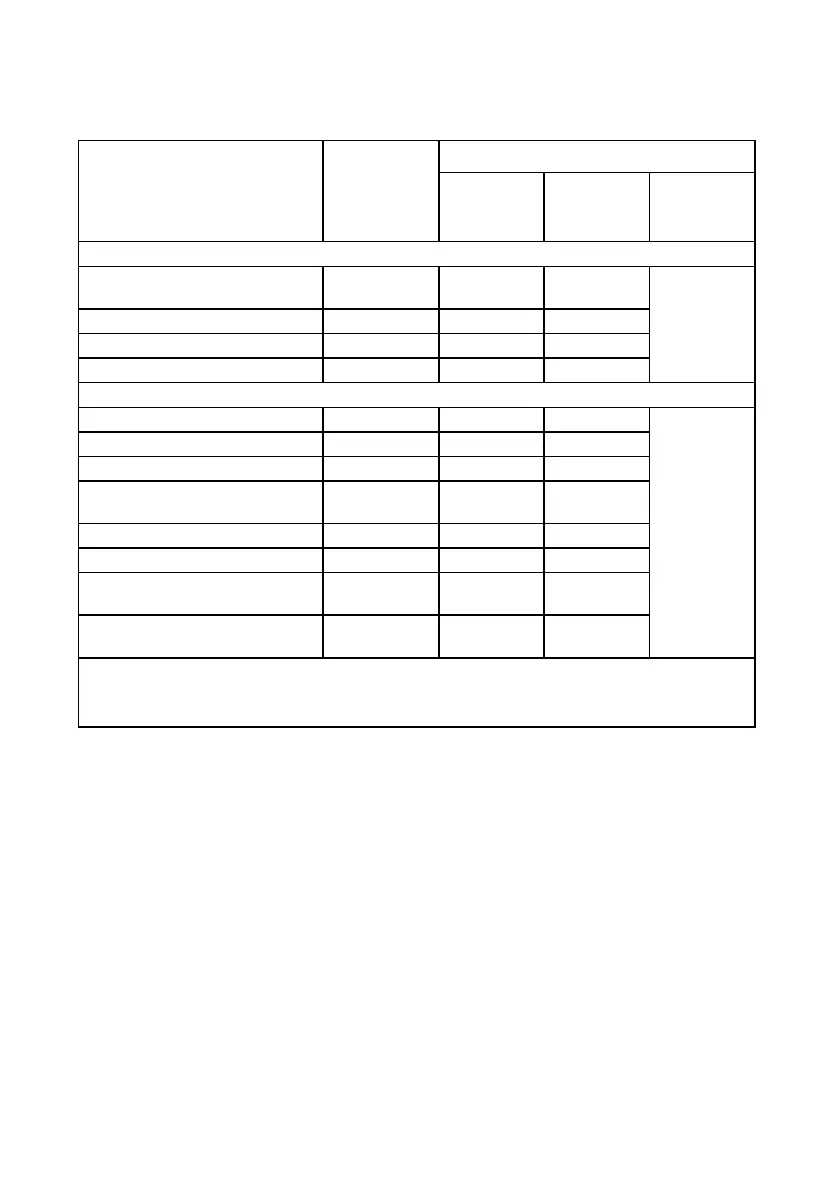
Table 17. Demographics and primary diagnosis
Subjects with
Baseline Visit
(N=141)
Arm 1:
Tonic/Burst
(N=45)
Arm 2:
Burst/Tonic
(N=55)
Marital Status, n/N (%)
Married
107/141
(75.9%)
39/45
(86.7%)
41/55
(74.5%)
0.479
f
Separated/divorced 13/141 (9.2%) 2/45 (4.4%) 4/55 (7.3%)
Single 8/141 (5.7%) 2/45 (4.4%) 3/55 (5.5%)
Widowed 13/141 (9.2%) 2/45 (4.4%) 7/55 (12.7%)
Diagnosis, n/N (%)
Arachnoiditis 1/141 (0.7%) 1/45 (2.2%) 0/55 (0.0%)
0.189
f
CRPS I/CRPS II 2/141 (1.4%) 0/45 (0.0%) 2/55 (3.6%)
Degenerative spine disease 7/141 (5.0%) 1/45 (2.2%) 2/55 (3.6%)
Failed back surgery
syndrome (FBSS)
59/141
(41.8%)
15/45
(33.3%)
27/55
(49.1%)
Neuritis/neuropathy/neuralgia 3/141 (2.1%) 0/45 (0.0%) 2/55 (3.6%)
Postoperative chronic pain 5/141 (3.5%) 1/45 (2.2%) 2/55 (3.6%)
Radiculopathies
52/141
(36.9%)
21/45
(46.7%)
17/55
(30.9%)
Chronic pain (non-
postoperative)
12/141 (8.5%) 6/45 (13.3%) 3/55 (5.5%)
t
Two-sample t-test
c
Chi-square test
f
Fisher's exact test