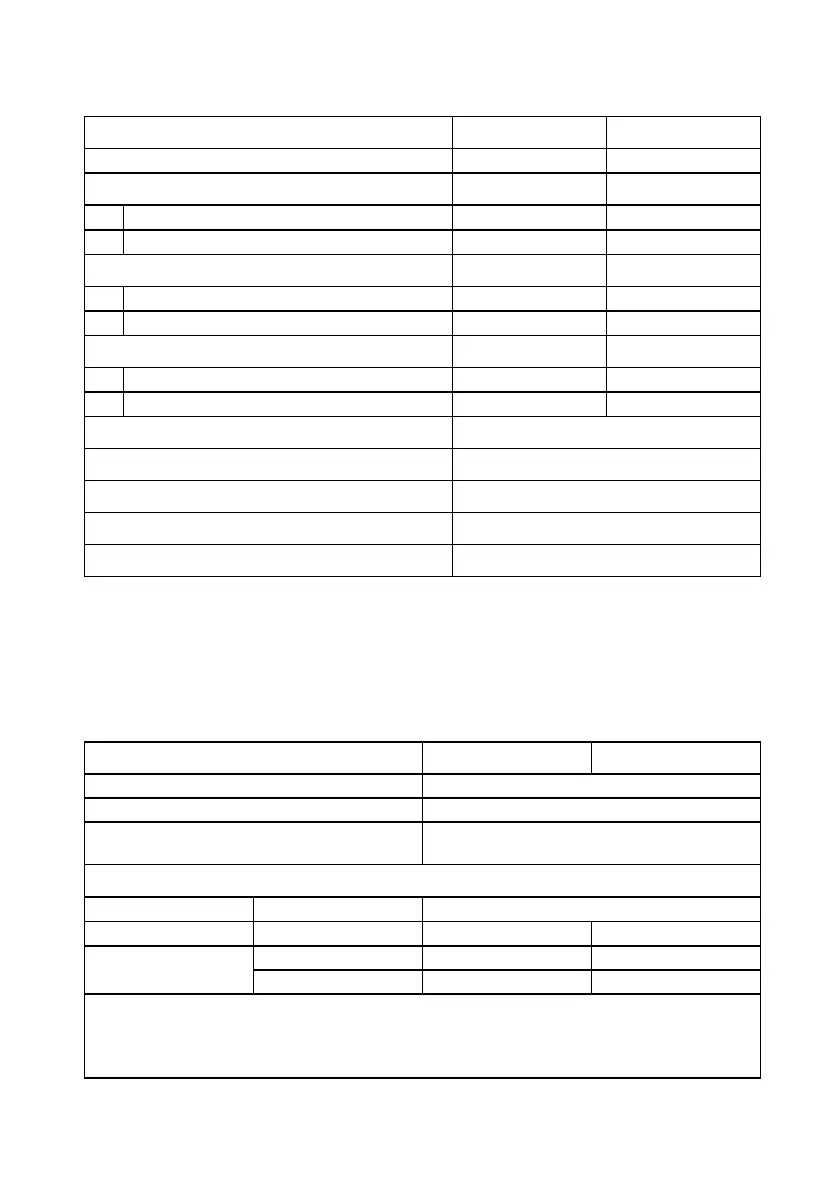
Table 33. Change in overall VAS score from baseline to week 12
Arm 1: tonic/burst Arm 2: burst/tonic
Stimulation
Tonic Burst
Mean ± SD (N)
72.7±11.4 (45) 76.3±11.3 (55)
Minimum, Maximum
44.4, 90.3 43.9, 98.9
Mean ± SD (N)
46.3±22.8 (45) 44.2±25.3 (55)
Minimum, Maximum
1.0, 88.1 0.0, 98.1
Mean ± SD (N)
-26.4±24.9 (45) -32.1±26.7 (55)
Minimum, Maximum
87.4, 34.0 87.7, 15.0
-5.8±25.9
95% UCB on Difference (Burst-Tonic)
2.9
7.5
p
-value for Non-Inferiority Test
0.006
p
-value for Superiority Test
0.136
The following table shows a cross-tabulation of responder rates (≥50% decrease in overall VAS
score from baseline) with burst and tonic stimulation. A total of 49 subjects (49%) responded to
tonic stimulation, burst stimulation, or both. The overall VAS scores decreased by at least 50% for
more subjects with burst stimulation than with tonic stimulation (17 versus 10).
Table 34. Responder rates (decrease of ≥50% from baseline) for overall daily VAS score
Burst subjects (n/N) 39/100 (39.0%)
Tonic subjects (n/N) 32/100 (32.0%)
Difference in responder rate with 95% CI*
(Burst-Tonic)
7.0% (-1.0%, 19.0%)
Cross-Tabulation of Responders by Stimulation Mode
Stimulation mode
Tonic
Responder** No Yes
Burst
No 51/100 (51.0%) 10/100 (10.0%)
Yes 17/100 (17.0%) 22/100 (22.0%)
* 95% CI was calculated using asymptotic method without continuity correction (May and
Johnson, 1997; Newcombe, 1998)
** Responder is defined as a subject whose overall VAS score decreased 50% or more from
baseline.