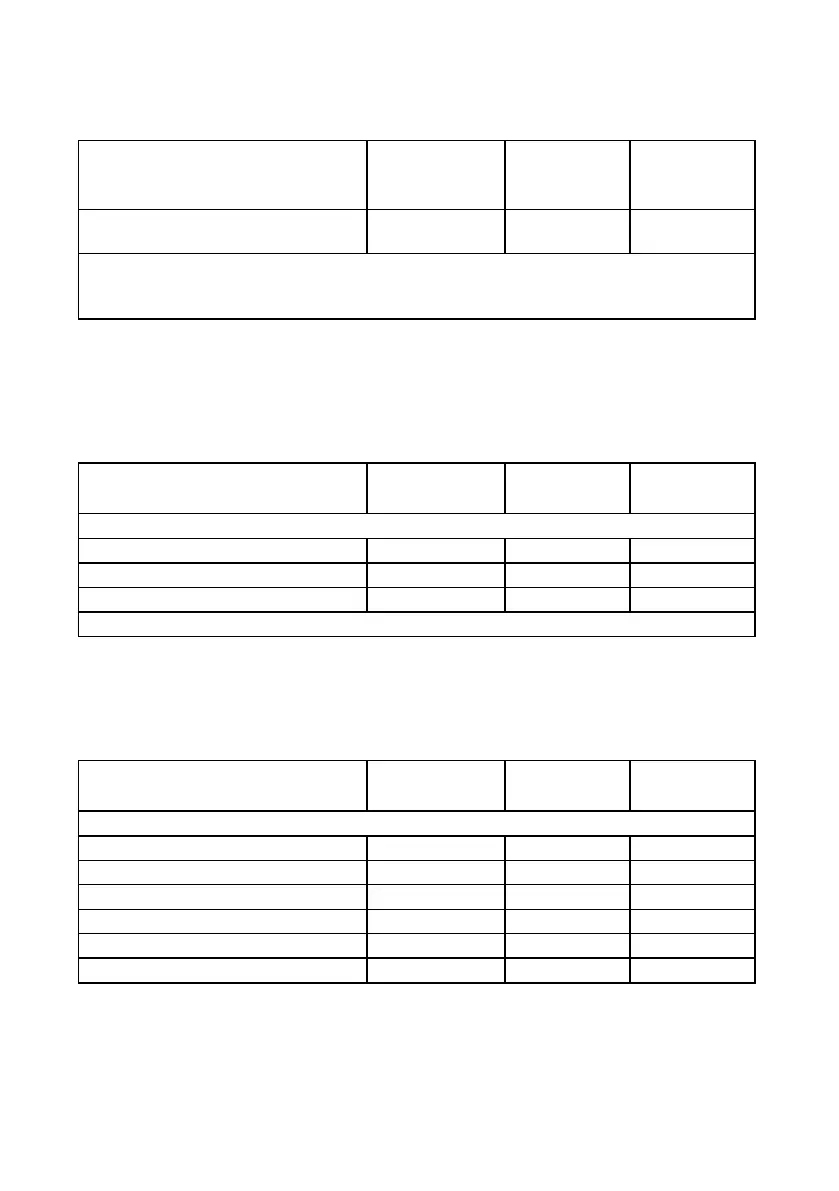
Table 20. Summary of all AEs
Percent of
Subjects
(n/N**)
All AEs total 158 67*
38.7%
(67/173)
* Some subjects experienced more than one event; therefore, the number of subjects
experiencing an event is not equal to the number of events in the neighboring column.
** Subjects at risk out of subjects enrolled in study
Two (1.2% of total number of subjects at risk) SAEs were reported that were categorized as study-
related. No study-related SAEs occurred following device activation. The following table
summarizes the SAEs that occurred before stimulation began.
Table 21. Summary of study-related SAEs
Percent of
Subjects (n/N*)
Enrollment to activation
Persistent pain and/or numbness 1 1 0.58% (1/173)
Unsuccessful lead placement 1 1 0.58% (1/173)
Total 2 2 1.16% (2/173)
* Subjects at risk out of subjects enrolled in study
The following table shows SAEs that were unrelated to the study. Nineteen (19) events were
reported in 15 subjects (8.7%). Thirteen (13) SAEs were reported following device activation.
Table 22. Summary of non-study related SAEs
Percent of
Subjects (n/N)
Enrollment to activation
Abdominal pain
1 1 0.58% (1/173)
a
Bowel obstruction
1 1 0.58% (1/173)
a
Femur fracture
1 1 0.58% (1/173)
a
Hip pain/replacement
1 1 0.58% (1/173)
a
Low potassium levels
1 1 0.58% (1/173)
a
Persistent pain and/or numbness
1 1 0.58% (1/173)
a