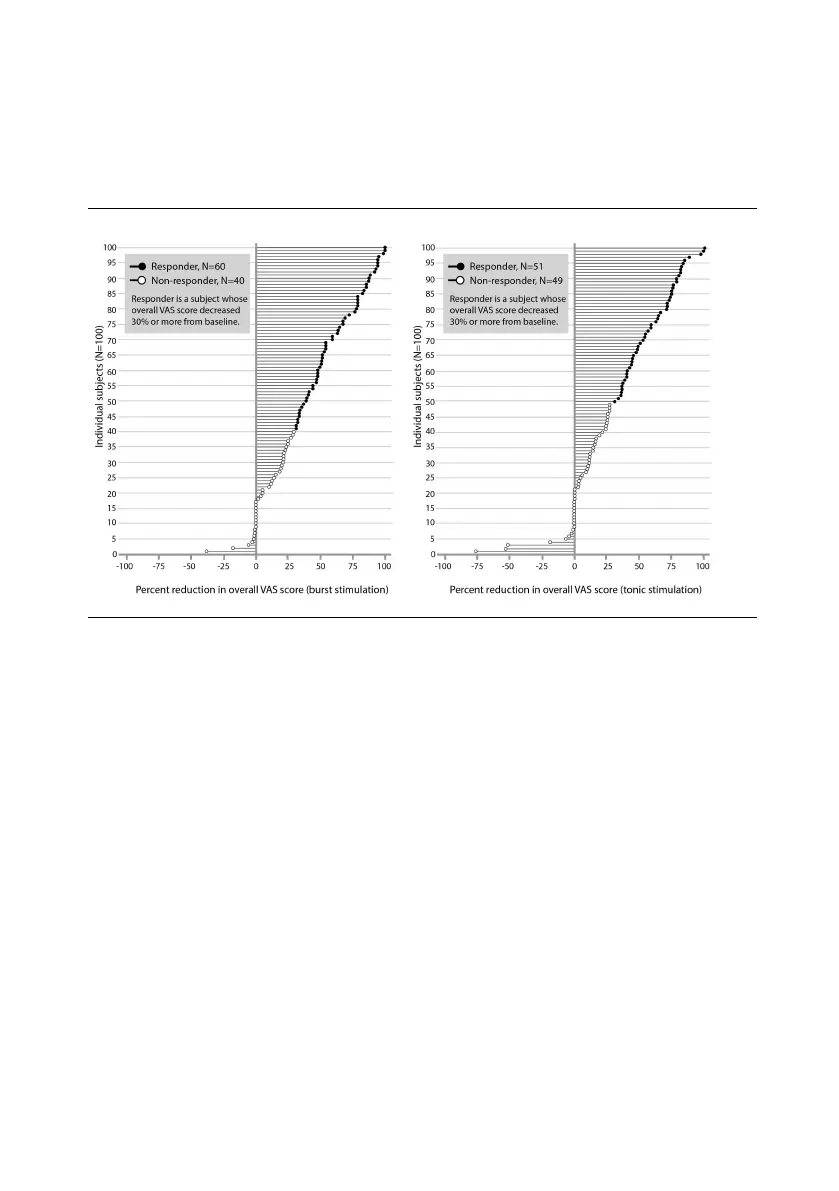
The following figure shows the percentage of pain relief for burst stimulation (left graph) and tonic
stimulation (right graph) in individual subjects overall from baseline through week 24. For this
figure, the responder rate was defined as a 30% or more reduction in the overall VAS score.
Figure 11. Percentage reduction (≥30% responder rate) in overall VAS score from baseline by
stimulation mode
The following figure shows the percentage of pain relief from burst stimulation (left graph) and
tonic stimulation (right graph) in the individual subjects for week 12, using a responder rate
definition of 30%.
 Loading...