Section 7 Technical Notes
26
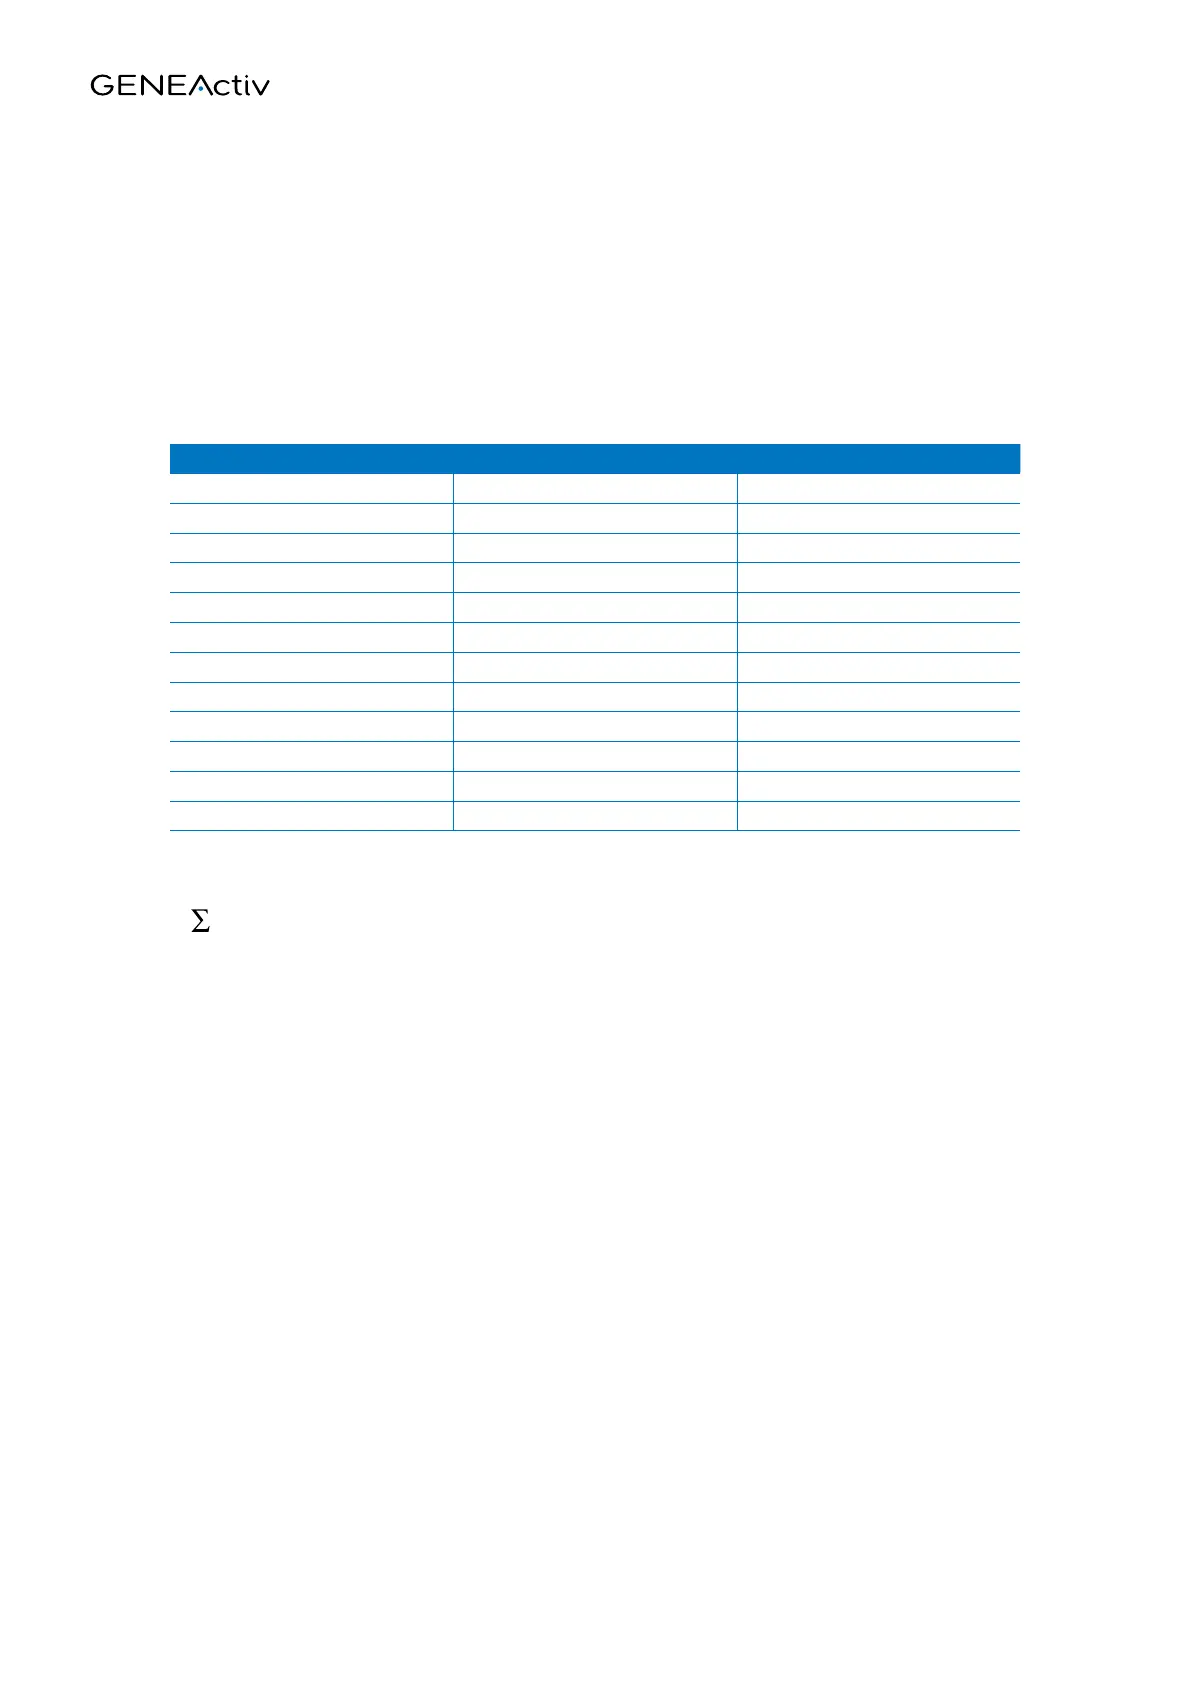
COLUMN RAW DATA EPOCH COMPRESSED
A time stamp time stamp of epoch end
B x axis (g) mean x axis
C y axis (g) mean y axis
D z axis (g) mean z axis
E light level (lux) mean lux
F button (1/0) sum button
G temperature (°C) mean temperature
H – sum of vector magnitudes
I – x axis standard deviation
J – y axis standard deviation
K – z axis standard deviation
L – peak lux
Understanding .csv files
The first 100 rows of the .csv file is the header which contains all the information about the device, its firmware
and the trial that recorded the information.
In both the raw data and epoch compressed files, the data starts from row 101 and is organised in the
following columns:
In the epoch compressed .csv, the gravity-subtracted sum of vector magnitudes is calculated as follows:
For each measurement in the epoch the vector magnitude is created and 1g is subtracted. When the
accelerometer is static and the earth’s gravitation pull is the only acceleration, the result of this will be zero.
The total number of measurements in the sum is defined by multiplying the recording frequency by the epoch length.
Measurements from different recording frequencies and epoch lengths can be compared with suitable scaling.
SVM
g
s = | (x
2
+ y
2
+ z
2
)
½
- 1g |
 Loading...