ADOBE AUDITION 3.0
User Guide
92
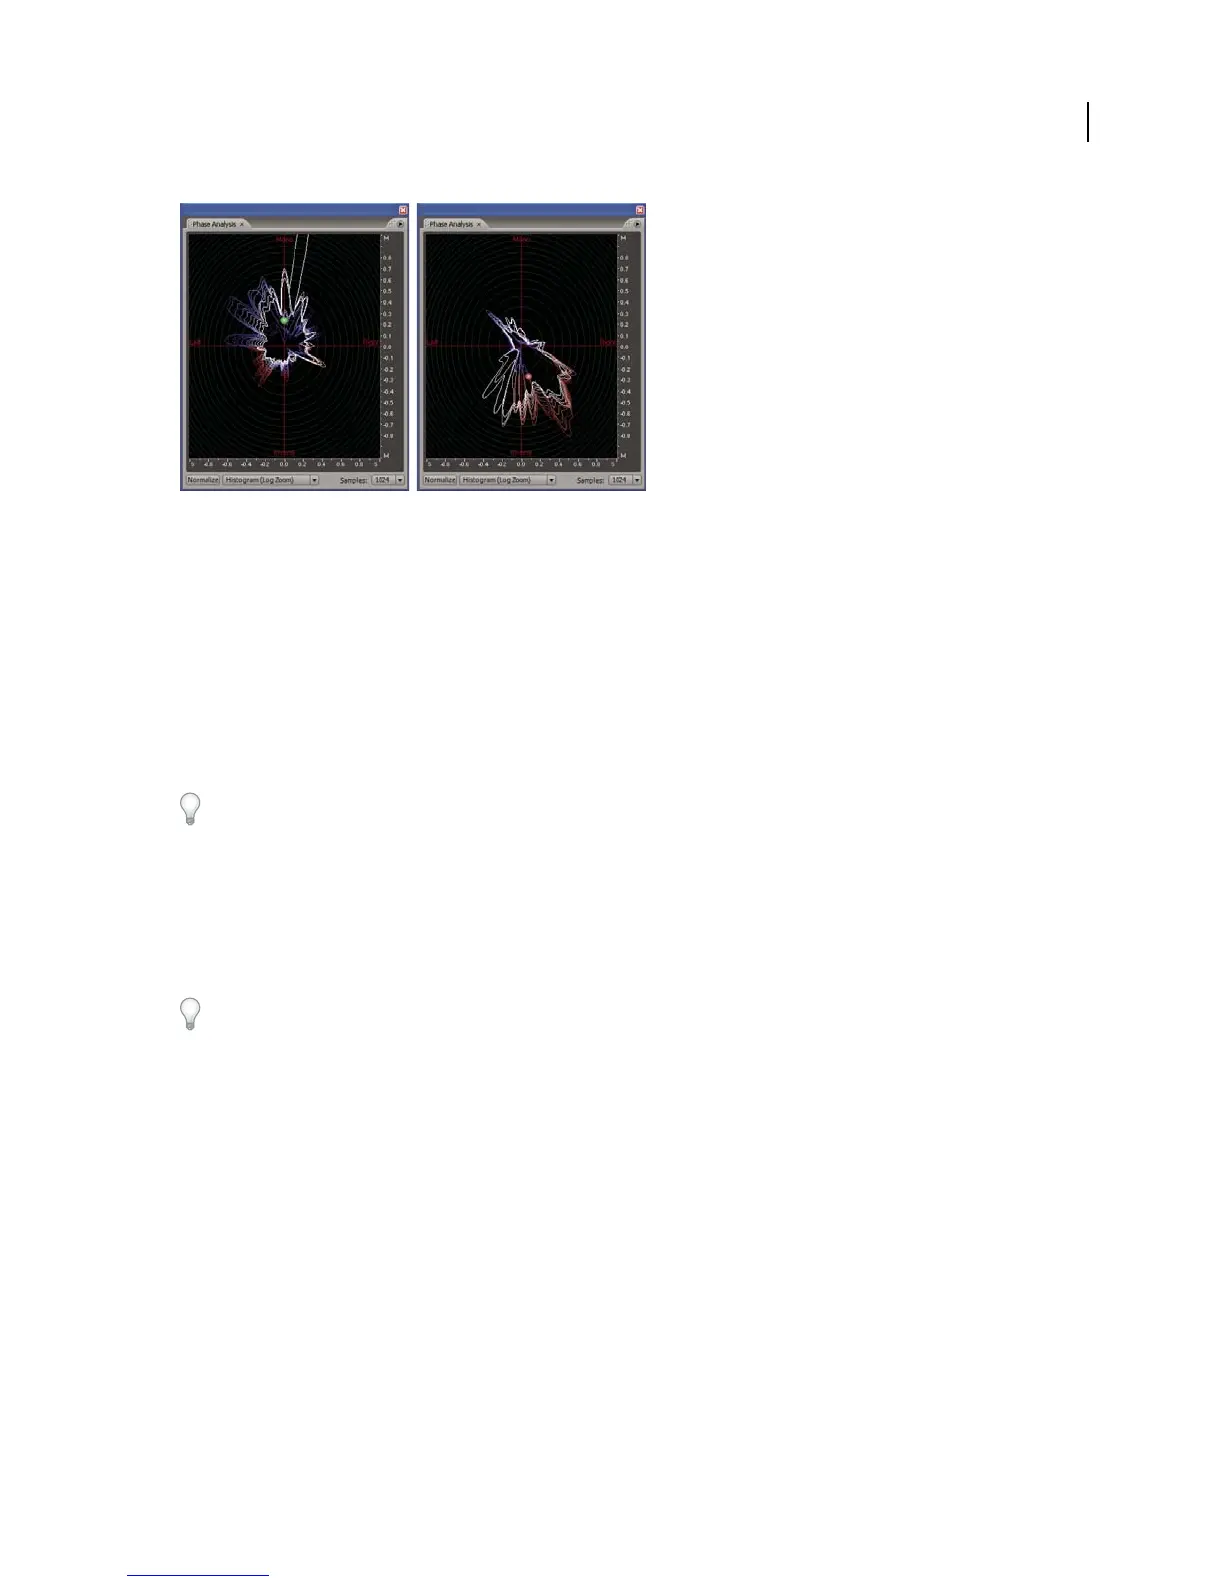
Phase Analysis panel using Histogram (Log Zoom) view:
A. In-phase audio B. Out-of-phase audio
1 In Edit View, choose Window > Phase Analysis.
2 In Waveform Display of Edit View, click a point, select a range, or start playback.
If you select a range, Adobe Audition analyzes the center point of the range.
3 Use the following display items to interpret the phase information shown in the Phase Analysis panel:
• By default, the graph shows stereo channels on the horizontal axis and phase information on the vertical axis.
In-phase audio appears in the top half of the graph; out-of-phase audio appears in the bottom half.
To zoom in on the graph, use the mouse wheel or right-click a ruler and drag the magnifying glass icon. (See “Zoom
phase and frequency graphs” on page 95.)
• The colored ball shows the overall stereo and phase location of audio. The ball turns red for out-of-phase audio,
green for in-phase audio, and yellow for borderline audio.
• The white outline shows the percentage of samples in each channel that are in- or out-of-phase, reflecting the
width of the stereo image.
Ifyouplantocreateamonoversionofastereofile(forAMradio,forexample),notethewidthofthestereoimage.
If it’s very broad, the file will sound significantly different in mono.
• The colored tracer lines indicate whether the waveform is more in phase (blue) or out of phase (red).
See also
“Invert a waveform” on page 87
“About Spectral Phase Display” on page 67
Phase Analysis options
Set the following options to customize the Phase Analysis panel:
Normalize Adjusts the phase analysis lines so that they reach the edge of the graph.
Chart Type menu Select from the following options:
• Left/Right Displays a Lissajou Plot graph in which a mono waveform appears as a diagonal line ascending from
left to right; a right-channel-only waveform appears as a horizontal line; a left-channel-only waveform appears as a
A
B