32
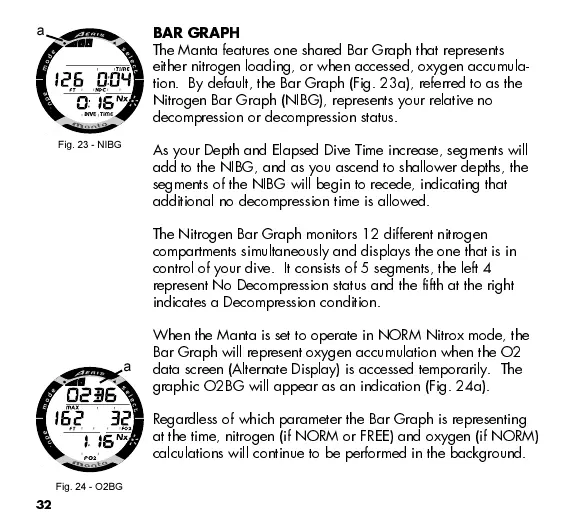
BAR GRAPH
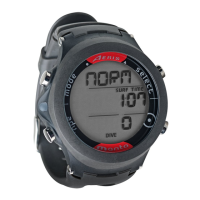
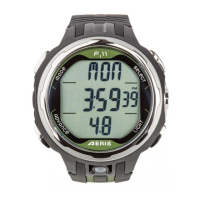
The Manta features one shared Bar Graph that represents
either nitrogen loading, or when accessed, oxygen accumula-
tion. By default, the Bar Graph (Fig. 23a), referred to as the
Nitrogen Bar Graph (NIBG), represents your relative no
decompression or decompression status.
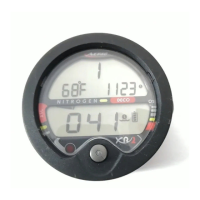
As your Depth and Elapsed Dive Time increase, segments will
add to the NIBG, and as you ascend to shallower depths, the
segments of the NIBG will begin to recede, indicating that
additional no decompression time is allowed.
The Nitrogen Bar Graph monitors 12 different nitrogen
compartments simultaneously and displays the one that is in
control of your dive. It consists of 5 segments, the left 4
represent No Decompression status and the fifth at the right
indicates a Decompression condition.
When the Manta is set to operate in NORM Nitrox mode, the
Bar Graph will represent oxygen accumulation when the O2
data screen (Alternate Display) is accessed temporarily. The
graphic O2BG will appear as an indication (Fig. 24a).
Regardless of which parameter the Bar Graph is representing
at the time, nitrogen (if NORM or FREE) and oxygen (if NORM)
calculations will continue to be performed in the background.
Fig. 24 - O2BG
Fig. 23 - NIBG
a
a
 Loading...