6-3
AIRFLOW CURVES
SM DLSDCI 3-A.1 GB
6.3 Model: DLS 36 DCI
6.4 Model: DLS 43 DCI
6-1
AIRFLOW CURVES
SM DLSDCI 2-A.5 GB
6. AIRFLOW CURVES
6.1 Model: DLS 36 DCI
6.2 Model: DLS 43 DCI
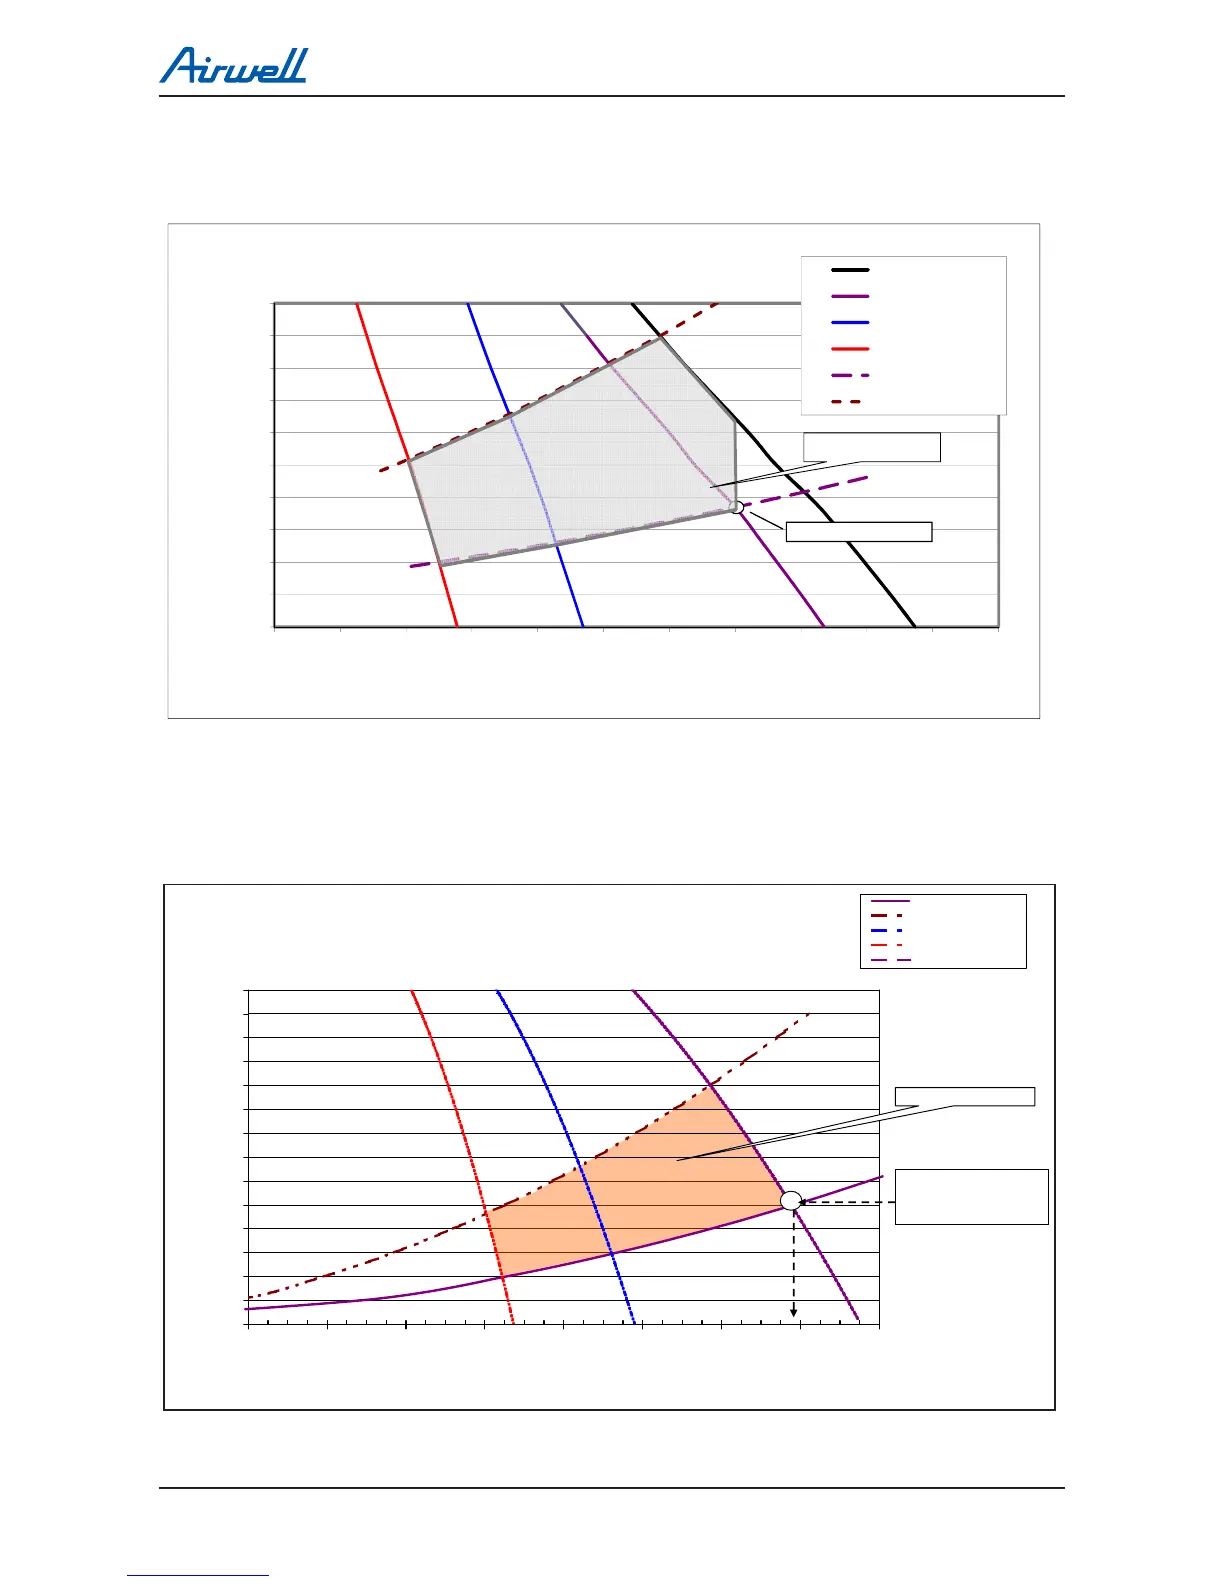
Air Flow vs. External Static Pressure
0
10
20
30
40
50
60
70
80
90
100
110
120
130
140
600 800 1,000 1,200 1,400 1,600 1,800 2,000 2,200
Air Flow [m
3
/h]
External Static Pressure [Pa]
Nominal System Curve
Max System Curve
Medium Speed
Low Speed
High Speed
Performance test
point at 37 Pa
Operating Range
Air Flow vs. External Static Pressure
0
10
20
30
40
50
60
70
80
90
100
110
120
130
140
600 800 1,000 1,200 1,400 1,600 1,800 2,000 2,200
Air Flow [m
3
/h]
Nominal System Curve
Max System Curve
Medium Speed
Low Speed
High Speed
Performance test
point at 50 Pa
Operating Range
External Static Pressure [Pa]
DNG 36
1.075294
0.86983905
SH H ML
0 1973
1835
1469
1278
46.21799 1900 103.4 1700
10 1936
1800
1453
1264 41.48097 1800 91.6 1600
25 1876
1745 1429 1243
39.20848 1750 90.0 1586 3.57797E-05
37 1828
1700
1411
1227
37 1700 1.28028E-05 70.1 1400
50 1762
1639
1388
1207
32.77509 1600 60.5 1300
60 1720
1600
1368
1190
25.09343 1400 51.5 1200
80 1628
1514
1329
1156
18.43599 1200 47.3 1150
90 1586 1475 1311 1141
100 1543
1435
1293
1125
Nom MAX
0
10
20
30
40
50
60
70
80
90
100
1000 1100 1200 1300 1400 1500 1600 1700 1800 1900 2000 2100
External Static Pressure, Pa
Air Flow Rate, m^3/hr
Airflow Vs. External Static Pressure
Turbo Speed
High Speed
Medium Speed
Low Speed
Nominal system Curve
Max System Curve
Point for Performance test
Operatingrange
 Loading...