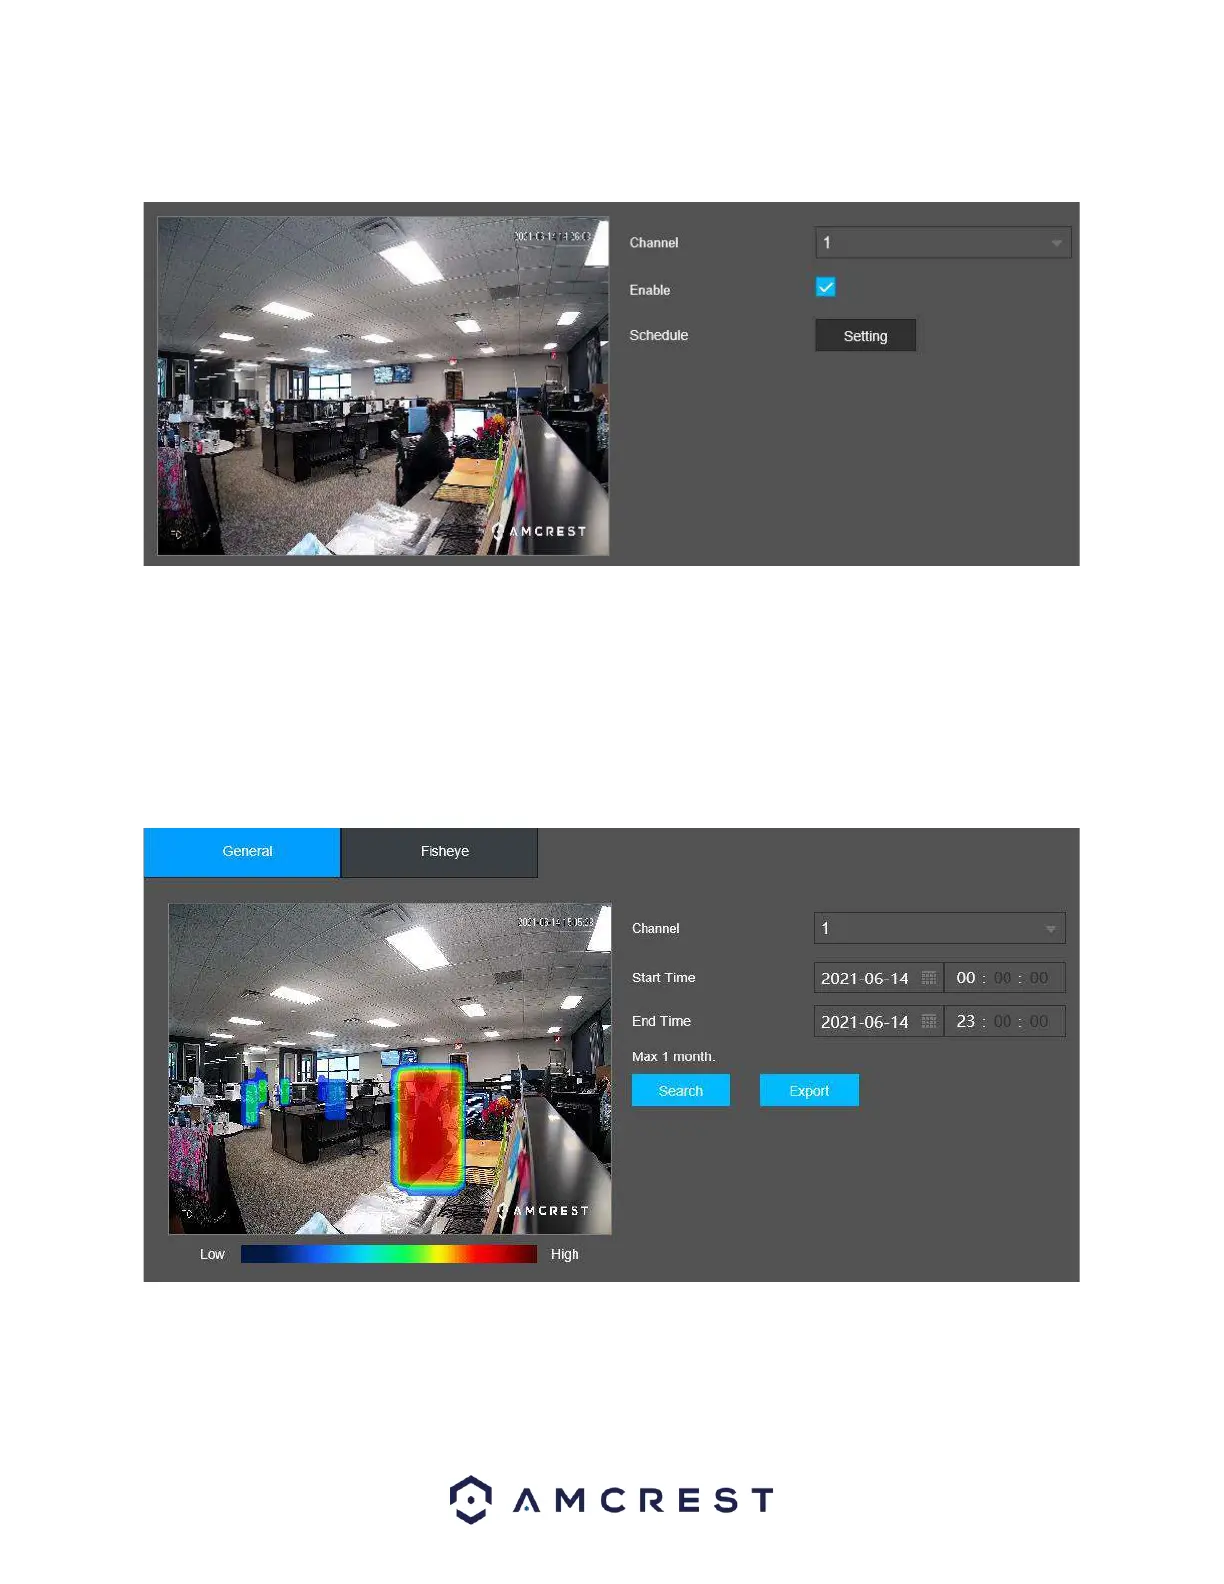
2. Enable the Heat Map checkbox to turn on the feature. Click Save.
Note: A schedule can be set for this feature by clicking on the Setting button in the Schedule field. This
will allow the feature only to function during specific times set by the user.
3. To view Heat Map data, click on the AI Search option and click on Heat Map. There are 2 tabs, one for
general and fisheye event types. Select an event tab and enter a start and end time into the interface and
click Search. The heat map period cannot exceed one month of reporting. All heat map data will appear
in the interface.
Note: An image or excel sheet of this data can be exported and backed up to a computer if needed. To
export the data, click Export and set a file path, then download.