AZI Sales/Customer Service 800-528-7411 or 602-470-1414 or support@azic.com Page 23 of 26
6.2.1 Graph
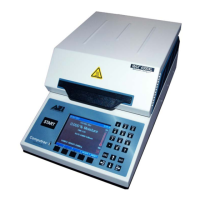
Available only on the MAX
®
4000XL.
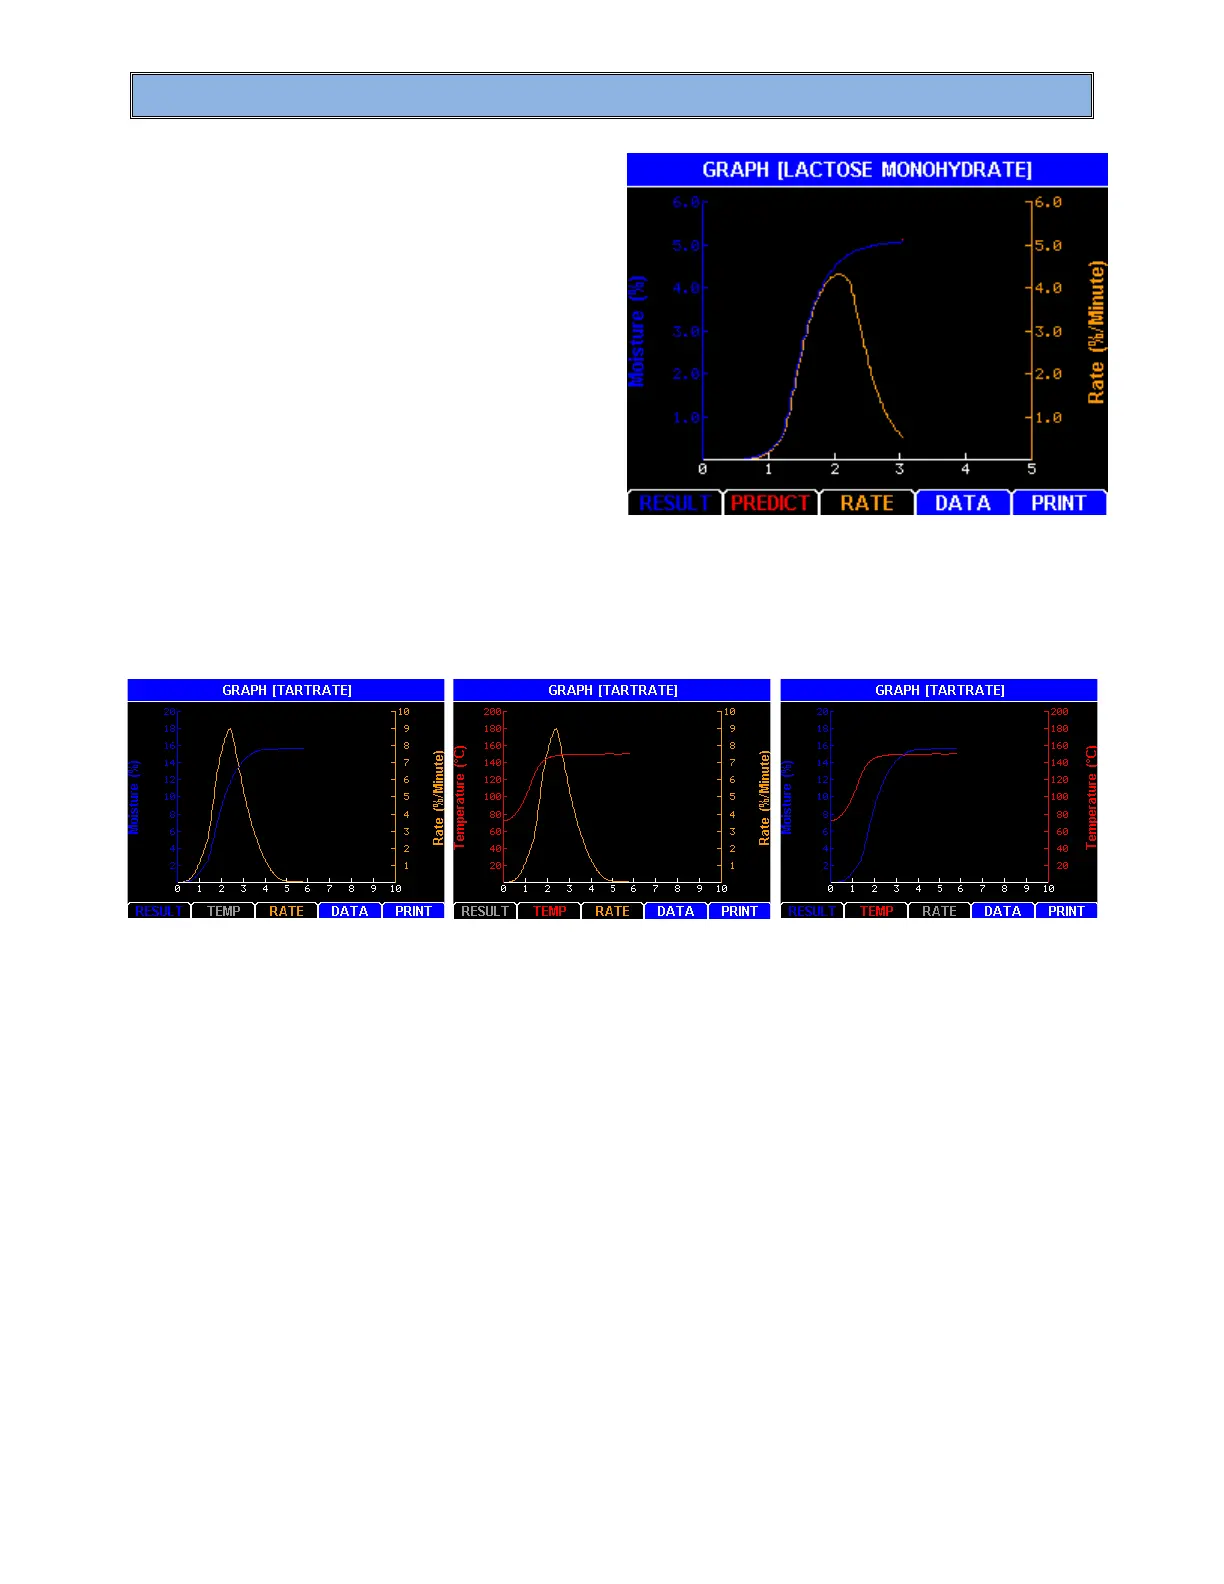
Pressing the [GRAPH] from the Main Test
screen or when viewing Test Results brings
up the test graph. The [RESULT], [TEMP],
[PREDICT], and [RATE] soft keys allow
their specific curves to be removed from or
added to the graph. The color of the text in
the soft key corresponds to the color of that
specific graph: Blue for RESULT, Red for
TEMP or PREDICT, and Orange for RATE.
The specific curves that are available for viewing on the graph will vary depending on the
ending criteria for the test being viewed. The [PREDICT] soft key is only shown on tests
that use the Prediction ending criteria, while the [TEMP] soft key is only available on tests
that do not use the Prediction ending criteria.
As shown in the three TARTRATE graphs above, the soft keys are used to toggle whether
or not a particular curve is displayed:
• Press the corresponding soft key once to hide a particular curve from the graph;
• Press the soft key again to display the hidden curve.
• Press [DATA] to return the previous screen, either the Main Test screen or the
Test Results display screen.
The graph can be printed by pressing [PRINT].
 Loading...