Antenna Analyzer AIM4170 page 13
If the actual measured value is off the scale (flat line at the top of the graph), the value
readout by the cursor is still valid since it uses the raw data stored in memory. For
example, you can set the Zmag scale to 500 ohms in order to see fine details but if the
impedance actually goes up to 1600 ohms at some frequencies, the cursor can still read
the true value and display it in the data window.
If you select a new scale factor, the last data scan will be replotted using that scale.
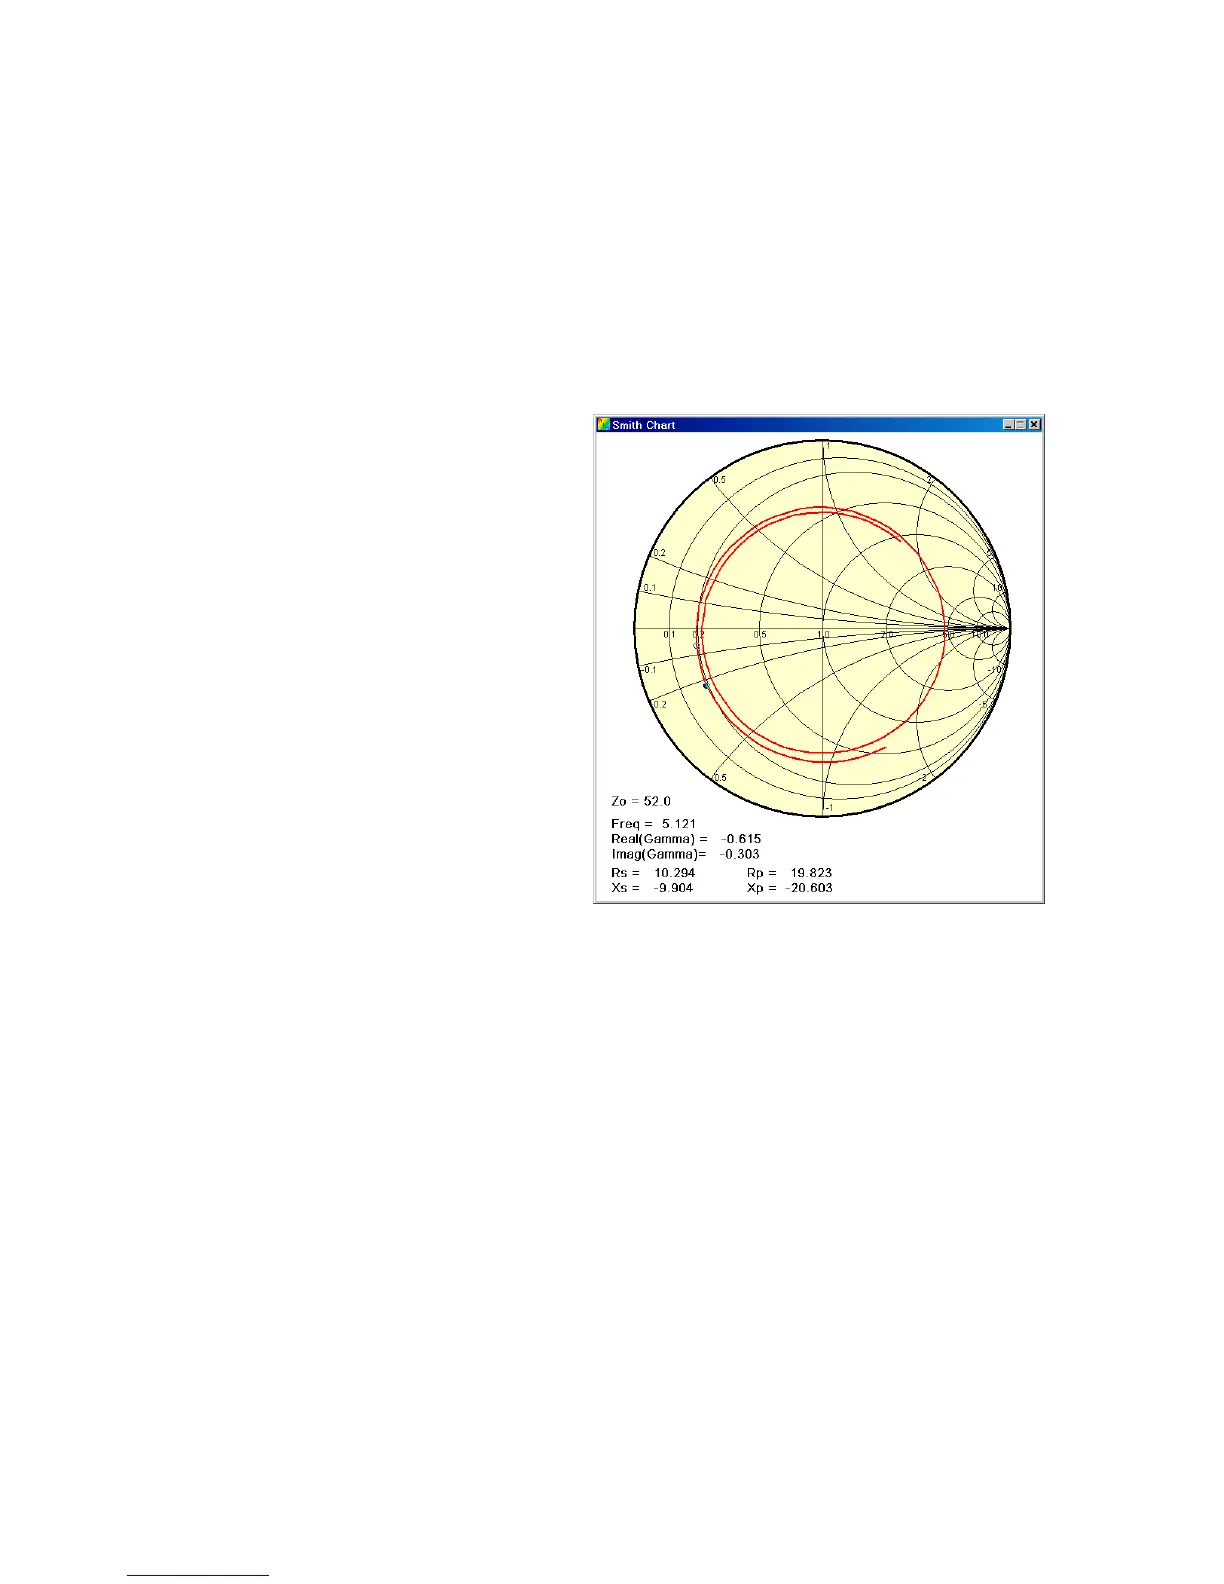
SMITH – A window is displayed with a
Smith chart showing a plot of the
reflection coefficient versus frequency.
As the cursor is moved with the mouse
over the original plot, a marker dot is
displayed at the corresponding point on
the Smith chart and the relevant data is
displayed in this window.
Note, the point that is highlighted on the
Smith chart corresponds to the
frequency on the horizontal frequency
axis of the original graph. This graph is
under the Smith chart and the horizontal
axis may not be completely visible, but
the actual frequency that the cursor is
pointing to is displayed on the Smith
chart itself.
This particular plot corresponds to the
scan shown on page 23 which uses 28
feet of RG58/U terminated with 301
ohms.
[The center of the Smith chart
corresponds to 52 ohms in this
example. The Zo value is specified
using the Setup Menu.]
COMMENT – A dialog box pops up for you to enter a comment that will be displayed at
the bottom of the graph. This is very useful for documenting the test conditions. This
comment will appear in a screen capture or a screen print and it will be saved in the raw
data file on disk if this scan is saved.