Antenna Analyzer AIM4170 page 19
Data Window
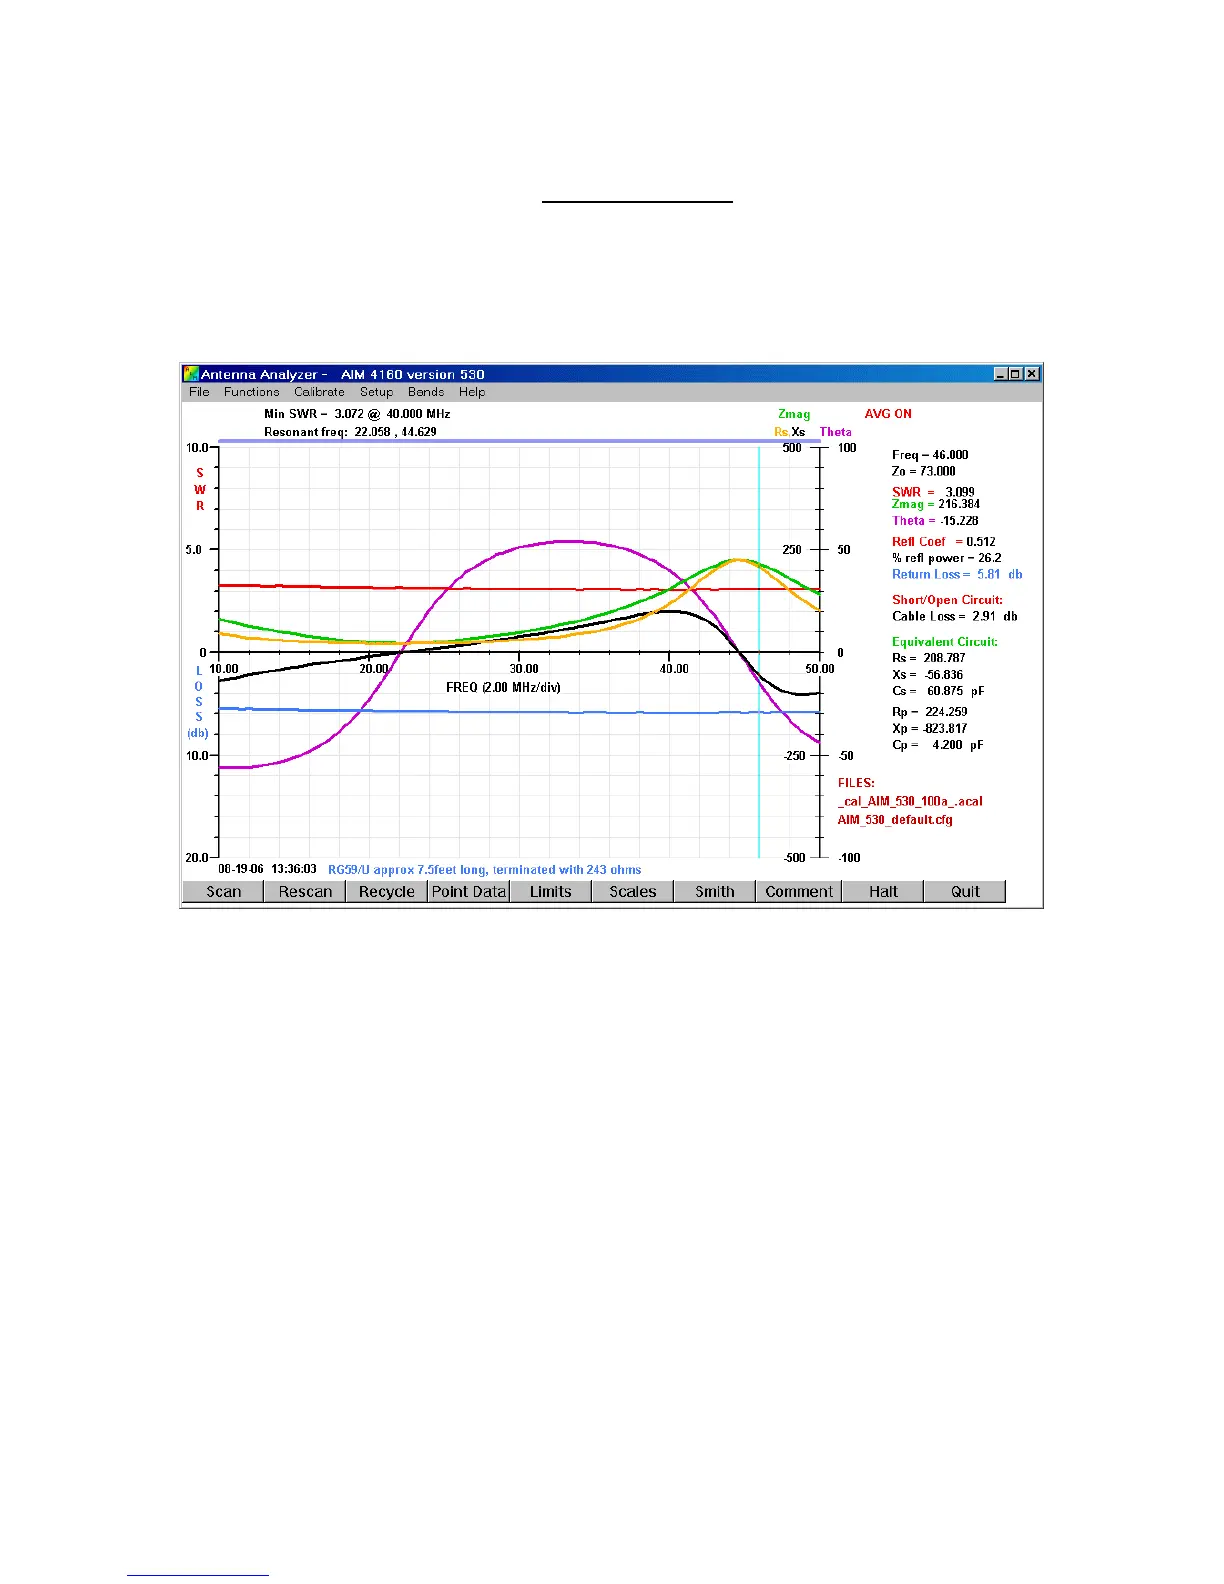
After a scan (or after loading a file from disk), the mouse can move a cursor along the
frequency axis and the numeric data for several parameters will be displayed
continuously in a data window on the right side of the screen. An example is shown
below:
The light cyan vertical line is the cursor. It moves with the mouse whenever the mouse
pointer is inside the graph area. In this example, the frequency is 46.000 MHz. The
frequency changes in 1-pixel increments due to the mouse resolution, so some specific
frequencies may not be displayable. The data is interpolated between the actual data
points that were recorded during the scan. The cursor can also be moved in small
increments using the Left/Right Arrow Keys on the keyboard.
Normally the cursor moves whenever the mouse pointer is inside the graph area. There
is an option in the configuration file to enable the cursor only when the left mouse button
is pressed.
Data in the window shows the characteristic impedance, Zo, has been specified to be 73
ohms. The SWR at 46.000 MHz is 3.099, Zmag=216.384 ohms, and Theta= -15.228
degrees. Note how the SWR decreases slowly as the frequency increases. This is due to
loss in the coax. Less energy arrives back from the reflection at the far end, so it appears
to the measurement system (or the transmitter) that the reflection is not as bad as it really
is.