- 48 -
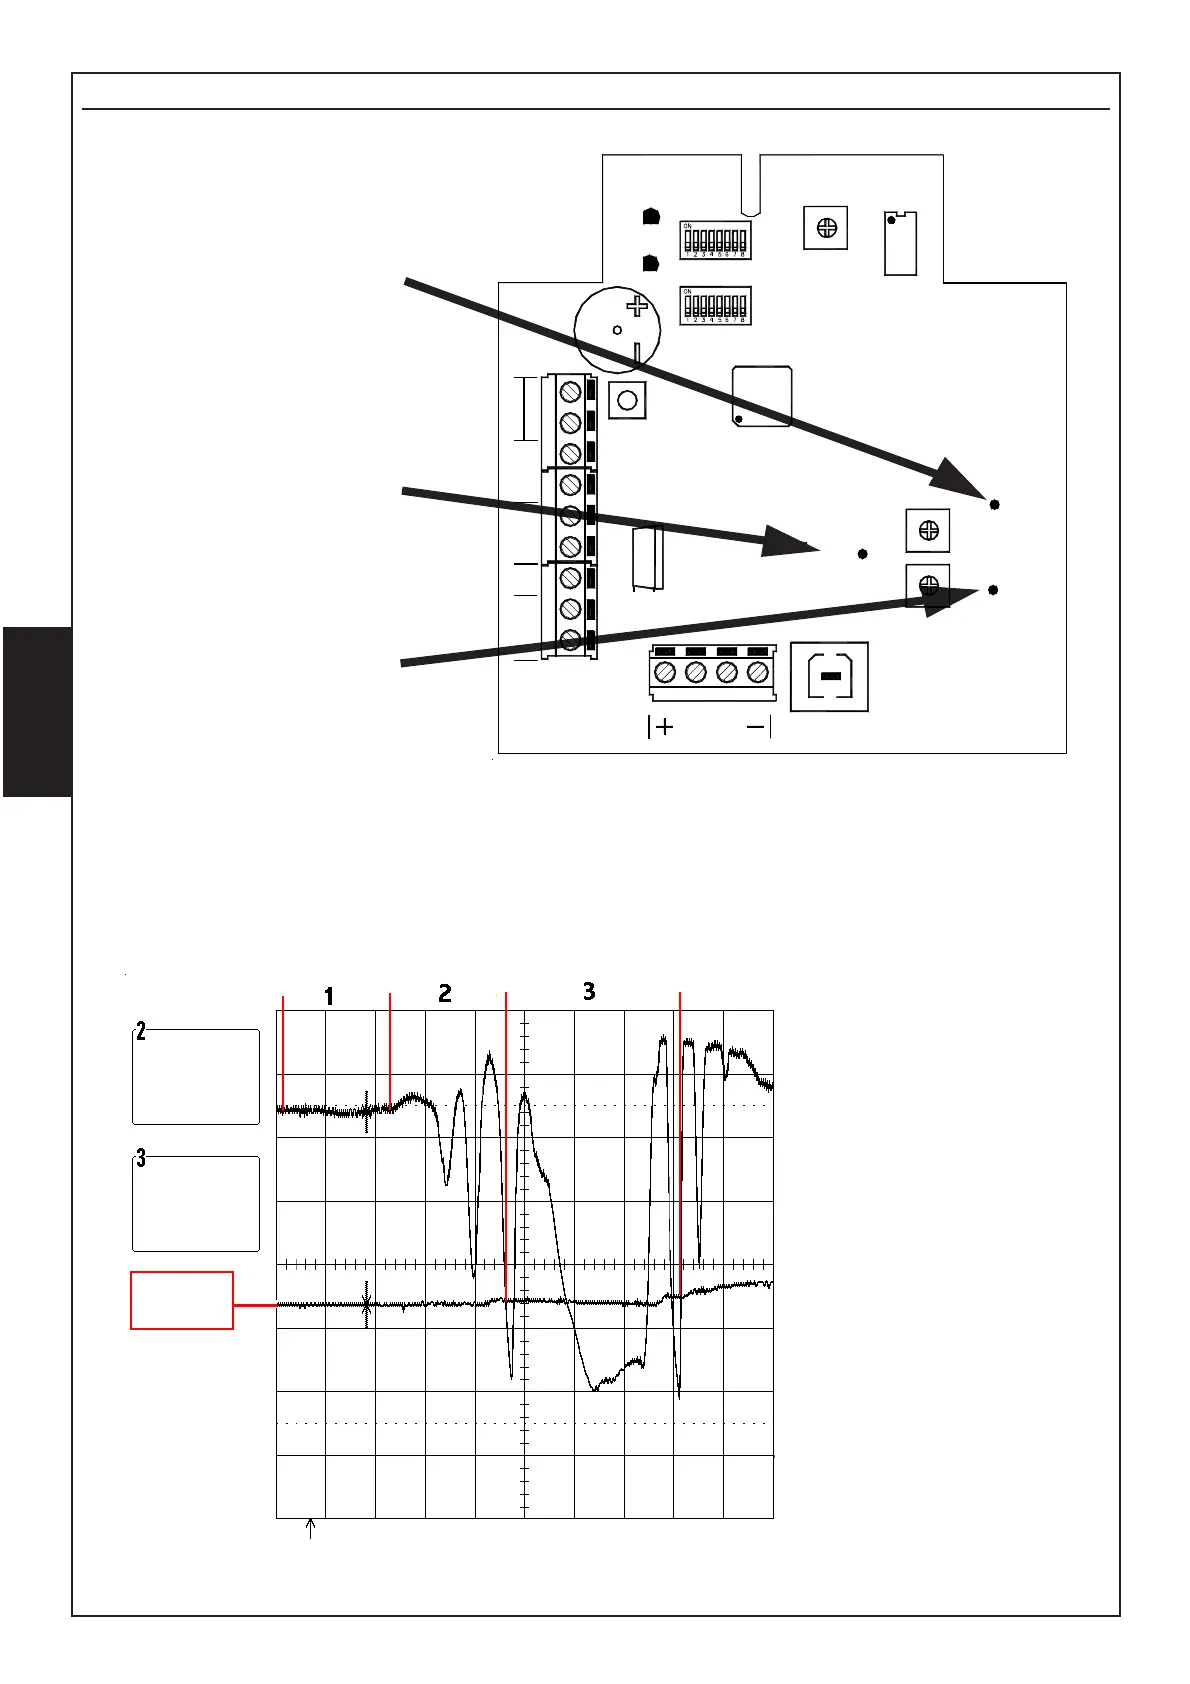
Measurements of the signal by oscilloscope
In the drawing below, the points where to connect
the oscilloscope are shown:
Point B shows the quality
of the signal received
In the graphic here below the wave shapes concerning the signal quality are shown:
1- the beam is in quiet condition and there is no passage of people or any perturbation due to
moving objects, the level is fix . Check that the quiet condition is as described.
2- the beam is disturbed or we are crossing a sensitive area (partial darkening)
3- the beam has been darkened and there is an alarm situation
Point C shows the alarm
threshold (trimmer sens.).
In this case the sensitivity
is adjusted at the half
C
B
.2 s
0.5 V
.2 s
0.5 V
.2 s
2 .1 V DC
x
10
3 .1 V DC
x
10
0 V
Sensitivity
range
Punto A
(ss)
Indicates the range
of the received
signal
Punto C
(SO)
Indicates the alarm
threshold
TAMPER
LEVEL
SENS.
COMP.
SW1
SW2
TP
1
B
FF
TAMPER
T T
CNC
AUX
DB
DA
LED
ROSSO
LED
VERDE
8
ON
ON
USB
SI
SS
SO
Punto B
(SI)
Indicates the quality
of the received
signal
GREEN
LED
RED
LED