ULT FREEZER – USER MANUEL
Updated 19. April 2021
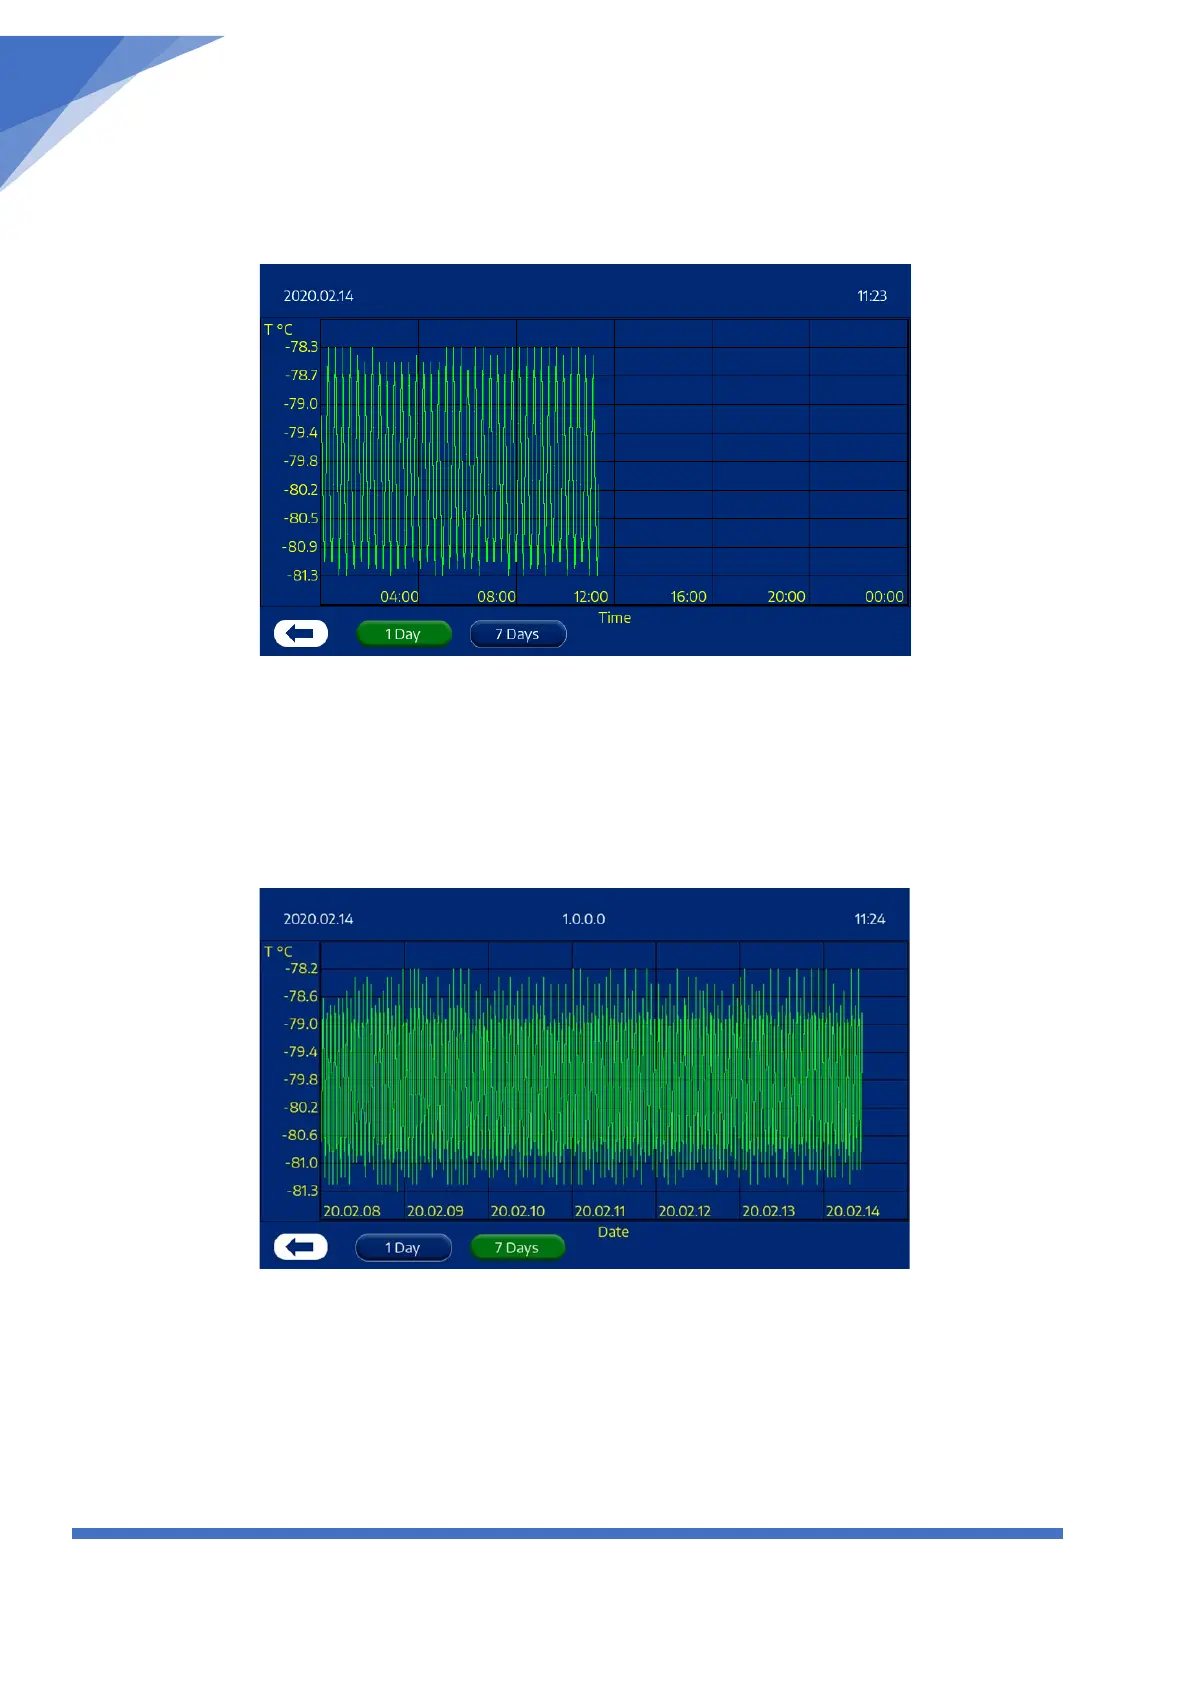
1. Temp. (Temperature graph)
Temperature graph for 1 day
First picture will show the temperature mapping of the current day.
Temperature graph for 7 days
You can select a Temperature Map for either 1 or 7 days
The second picture show the last 7 days (1 Week) temperature mapping.
 Loading...