Operating Temperatures and Pressures | 33SM Split CS Series Heat Pump
8733825873 (2020/05)SM Split CS Series Heat Pump
Subject to change without prior notice
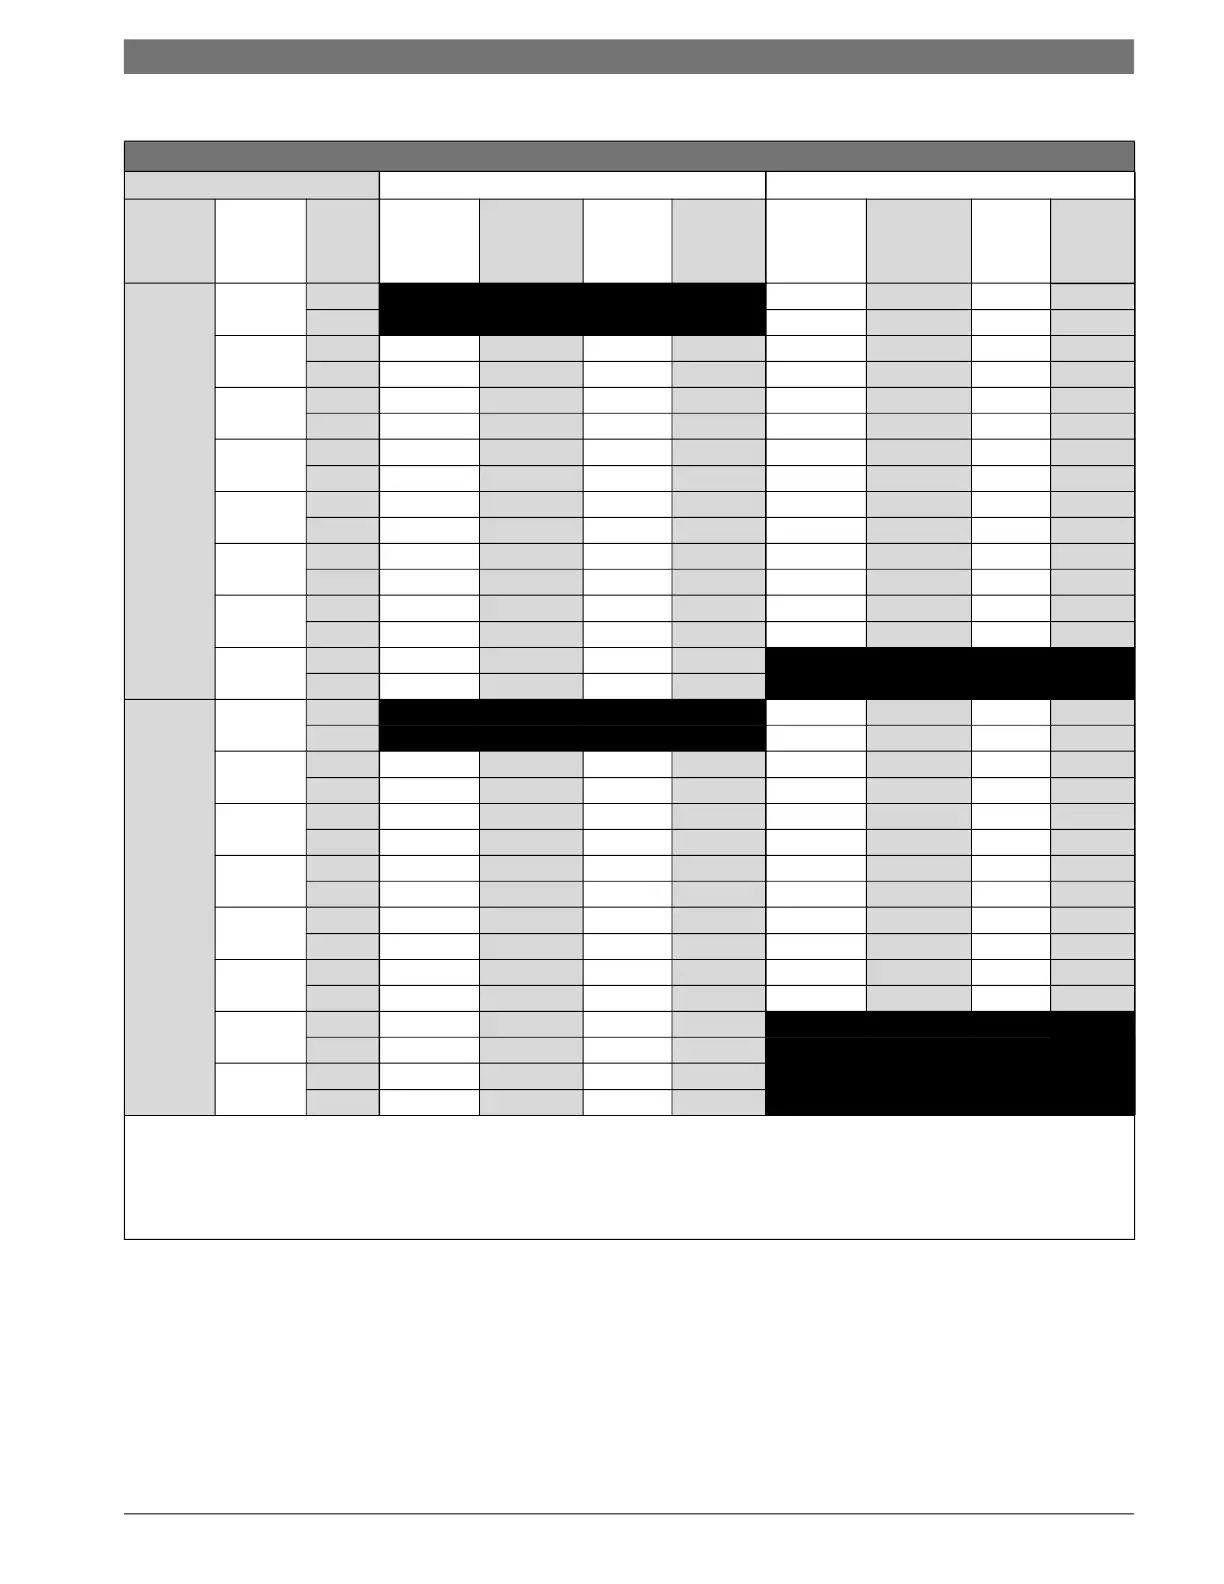
Table 18 SM036 Operating Temperatures and Pressures
Operating Temperatures and Pressures
Cooling Heating
Model
Entering
Water
Temp. F
Water
Flow
Suction
Pressure
PSIG
Discharge
Pressure
PSIG
Water
Temp.
Rise °F
Air
Temp.
Drop °F
Suction
Pressure
PSIG
Discharge
Pressure
PSIG
Water
Temp.
Drop
Air
Temp.
Rise °F
SM036
PART
LOAD
30°
4.5 73–89 266–325 5–6 15–18
9.0 77–94 272–333 3–4 16–19
40°
4.5 117–143 189–231 14–17 18—22 86–105 279–341 6–7 17–21
9.0 112–137 178–217 8–9 19–24 90–110 286–350 4–5 18–22
50°
4.5 126–154 221–270 14–17 18–21 105–125 293–358 7–8 20–24
9.0 121–148 207–253 8–9 19–23 109–130 300–366 5–6 21–25
60°
4.5 131–160 252–308 13–16 17–21 110–134 306–374 8–10 22–27
9.0 125–153 237–290 8–9 18–22 115–141 314–383 6–7 23–28
70°
4.5 135–165 284–347 13–16 17–20 122–150 320–391 9–11 24–30
9.0 130–158 266–326 7–9 18–22 129–157 327–400 6–8 26–32
80°
4.5 140–171 320–391 13–16 16–20 134–164 333–407 11–13 27–33
9.0 134–164 300–367 7–9 17–21 141–172 341–417 7–9 28–35
90°
4.5 144–176 360–440 13–16 16–19 147–179 347–424 12–14 29–36
9.0 138–169 338–414 7–9 17–21 154–188 355–434 8–10 31–38
100°
4.5 149–182 405–495 13–15 15–19
9.0 143–174 381–465 7–9 16–20
SM036
FULL
LOAD
30°
4.5 74–90 244–299 3–4 13–15
9.0 78–95 251–306 2–3 13–16
40°
4.5 122–149 183–224 14–18 19–23 87–106 257–314 4–5 15–18
9.0 117–143 172–210 8–10 20–24 91–111 263–322 3–3 16–19
50°
4.5 131–160 214–261 14–18 18–22 95–105 269–329 5–6 17–20
9.0 126–154 201–245 8–10 19–24 100–125 276–337 3–4 18–22
60°
4.5 136–166 244–298 14–17 18–22 111–136 282–344 6–7 19–23
9.0 131–160 230–281 8–10 19–23 117–143 289–353 4–5 20–24
70°
4.5 141–172 275–336 14–17 17–21 124–152 294–360 7–8 21–25
9.0 135–165 258–313 8–10 18–22 131–160 302–369 5–6 22–27
80°
4.5 145–178 310–378 14–17 17–20 136–166 307–375 8–9 23–28
9.0 140–171 291–356 8–10 18–22 143–175 314–384 5–6 24–30
90°
4.5 150–183 349–426 14–17 16–20
9.0 144–176 328–401 8–9 17–21
100°
4.5 155–189 392–480 13–16 16–19
9.0 149–182 369–451 8–9 17–21
This chart shows approximate temperatures and pressures for a unit in good repair. The values shown
are meant as a guide only and should not be used to estimate system charge. This chart assumes rated
airflow and 80º d.b./67º w.b. entering air temperature in cooling, 70º d.b. entering air temperature in
heating. Heating data at entering fluid temperatures below 50º assumes the use of antifreeze. As a result
of continuing research and development, specifications are subject to change without notice.