43
3. Adjust the screen settings:brightness and colour scheme.
4. Select the brightness of the light ring.
5.
Set up the displays for your measurements.
l
Go to SLM view to set up the instantaneous display (bar graph) and the readout for one broadband para-
meter
l
Go to List view to set up the instantaneous display (bar graph) and readouts for multiple broadband para-
meters (three on the instrument, five on the mobile app)
l Go to About data view to enable display of information about the data
About Screen Settings
Screen brightness: Choose from six levels of brightness.
Colour scheme: Choose light or dark.
About Light Ring Brightness
Light ring brightness controls the brightness of the light ring on the instrument. Choosefrom four settings:Off, Low,
Normal or High.
About Measurement Display Settings
l
Graph parameter (SLM view and List view)
Choose the parameter for the bar graph; that is, the instantaneous (or fast) display of instantaneous sound levels.
l
Graph max level, Graph min level (All views)
SLM view and List view: Define the range (maximum and minimum levels) for the bar graph in dB.
The range that you define should match the dynamics of the signal you are measuring. In other words, it should
include all the sound levels that are present.
l
Parameter (SLM view)
Choose the parameter to display in the area below the bar graph.
l
Parameter 1, 2 and 3 (List view)
Choose up to three parameters to display as a list below the bar graph. You do not have to define all three,
choose None to leave a list item blank.
l
Display
Enable or disable the display.
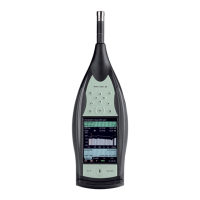
Set up the Instrument: Display Settings
 Loading...