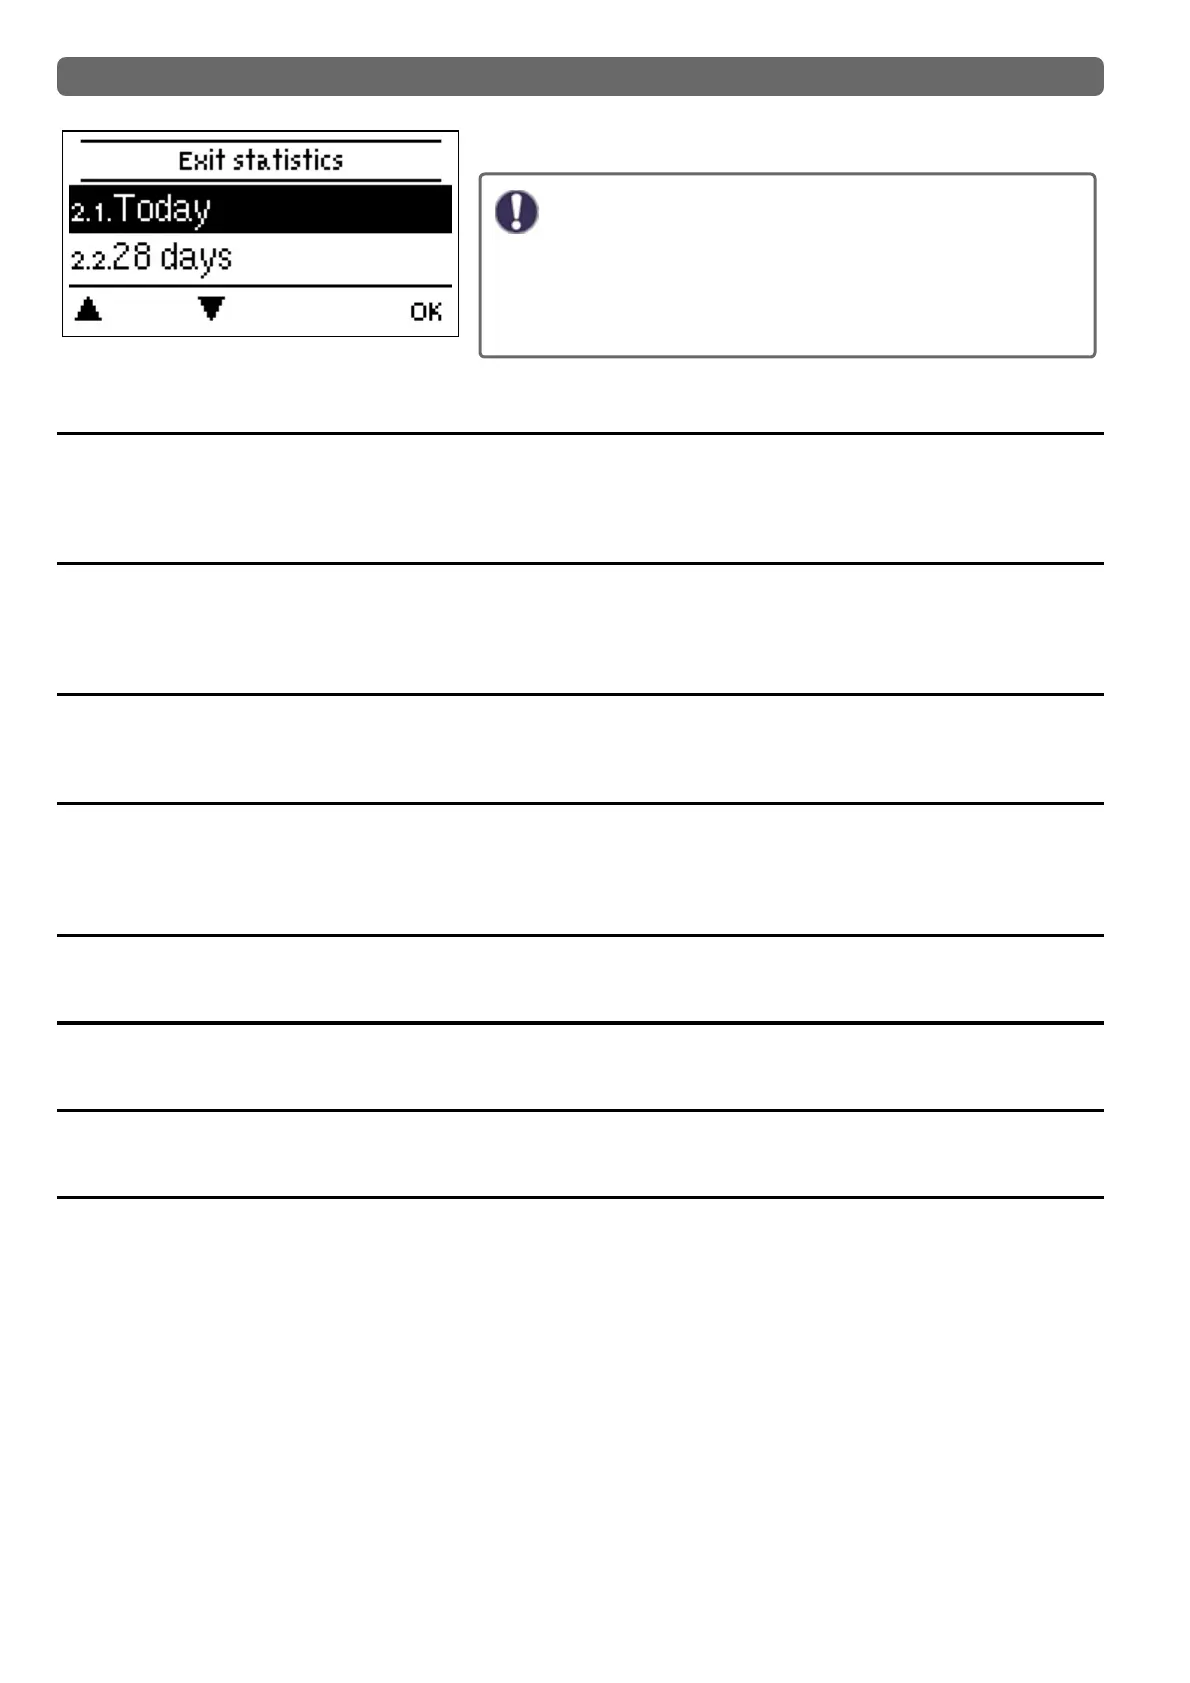
2. Statistics
Serve for function control and long-term monitoring of the system.
For system data statistics it is essential for the time to be set
accurately on the controller. Please note that the clock con-
tinues to run for about 24 hours if the mains voltage is inter-
rupted, and afterward must be reset. Improper operation or an
incorrect time may result in data being cleared, recorded incor-
rectly or overwritten. The manufacturer accepts no liability for
the recorded data!
Today
Flow temperature of the last 24 hours
In the graphical overview the characteristics of the flow for the present day is shown from 0 ... 24 h. The right button changes the
unit of time (days) and the two left buttons scroll through the diagram.
28 days
Flow temperature during the last 28 days
In the graphical overview the characteristics of the flow temperature during the last 28 days is shown. The right button changes
the unit of time (days) and the two left buttons scroll through the diagram.
Operating hours
Display of the operating hours of the consumers connected to the controller (for example, solar pumps, valves etc.) whereby dif-
ferent time ranges (day-years) are available!
Operating hours
Here the operating hours of the heating circuit and other switch or signal outputs are displayed. This is the entire time the heating
circuit pump and other switch or signal outputs were active. The displayed date in this menu is the date of the last deletion. From
this date on the current count is added.
Error messages
Display of the last 15 errors in the system with indication of date and time.
Reset / Clear
Resetting and clearing the selected statistics. Selecting ‚all statistics‘ clears everything except the error log.
Heat quantity
Display of the consumed heat quantity form the system in kWh.
Graphic overview
This results in a clear illustration of the data as a bar graph. Different time ranges are available for comparison. You can page
through with the two left keys.
12