211
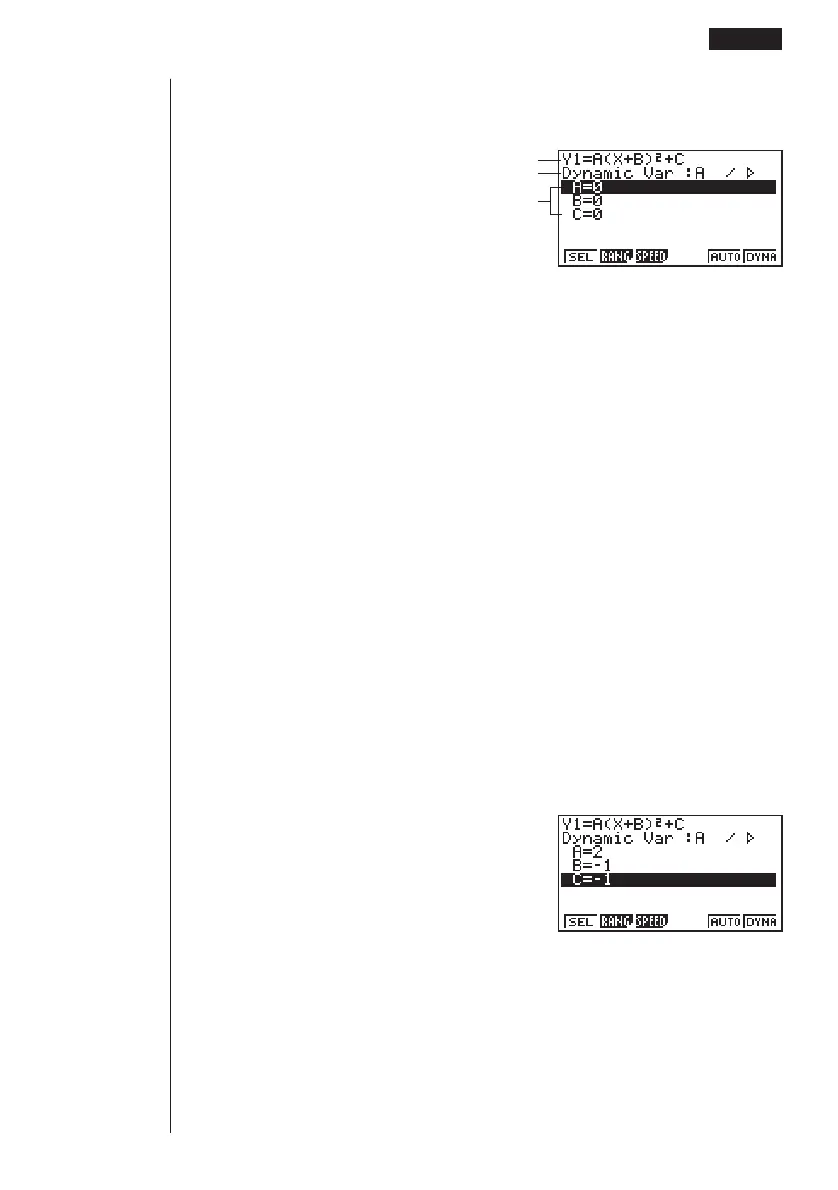
2. Display the coefficient menu.
4(VAR) or w
Function being graphed
Coefficient whose value will change
Coefficients in function
1 (SEL) ........ Selects dynamic coefficient
2 (RANG) .... Dynamic coefficient range settings
3 (SPEED) ... Dynamic Graph drawing speed
5 (AUTO) ..... Automatic setting of end and pitch values to match coefficient
values
6 (DYNA) ..... Dynamic Graph draw operation
• The calculator automatically makes the first variable it finds the dynamic coeffi-
cient. To select a different coefficient, use c and f to move the highlighting to
the coefficient you want to use, and the press 1 (SEL).
• The letters representing each coefficient are variables, and so the values that
appears on the screen are those currently assigned to each variable. If a com-
plex number is assigned to a variable, only the integer part appears.
• All variables contained in the currently selected function appear on the display in
alphabetical order.
• If there is more than one function that can be drawn using Dynamic Graph, the
message “Too Many Functions” appears on the display.
• If the value of the dynamic variable is zero and you press 5 (AUTO), the dy-
namic variable automatically changes to 1 and Dynamic Graphing is performed.
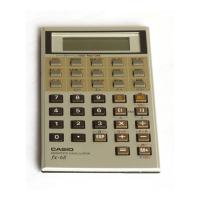
3. Specify the value of each coefficient.
cw
-bw
-bw
• If there is more than one coefficient, use f and c to move the highlighting to
each coefficient and input its value.
•Values you input for coefficients are also assigned to the corresponding variable.
123
4 56
1 2 3456
Drawing a Dynamic Graph 13 - 3