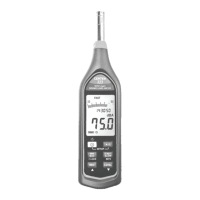
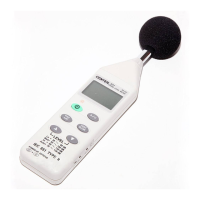
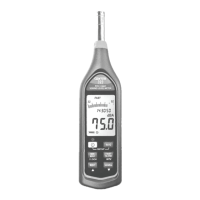
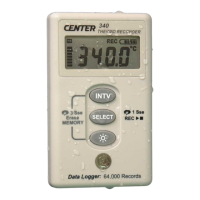
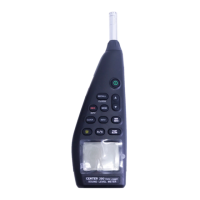
DATA LOGGER SOUND LEVEL METER
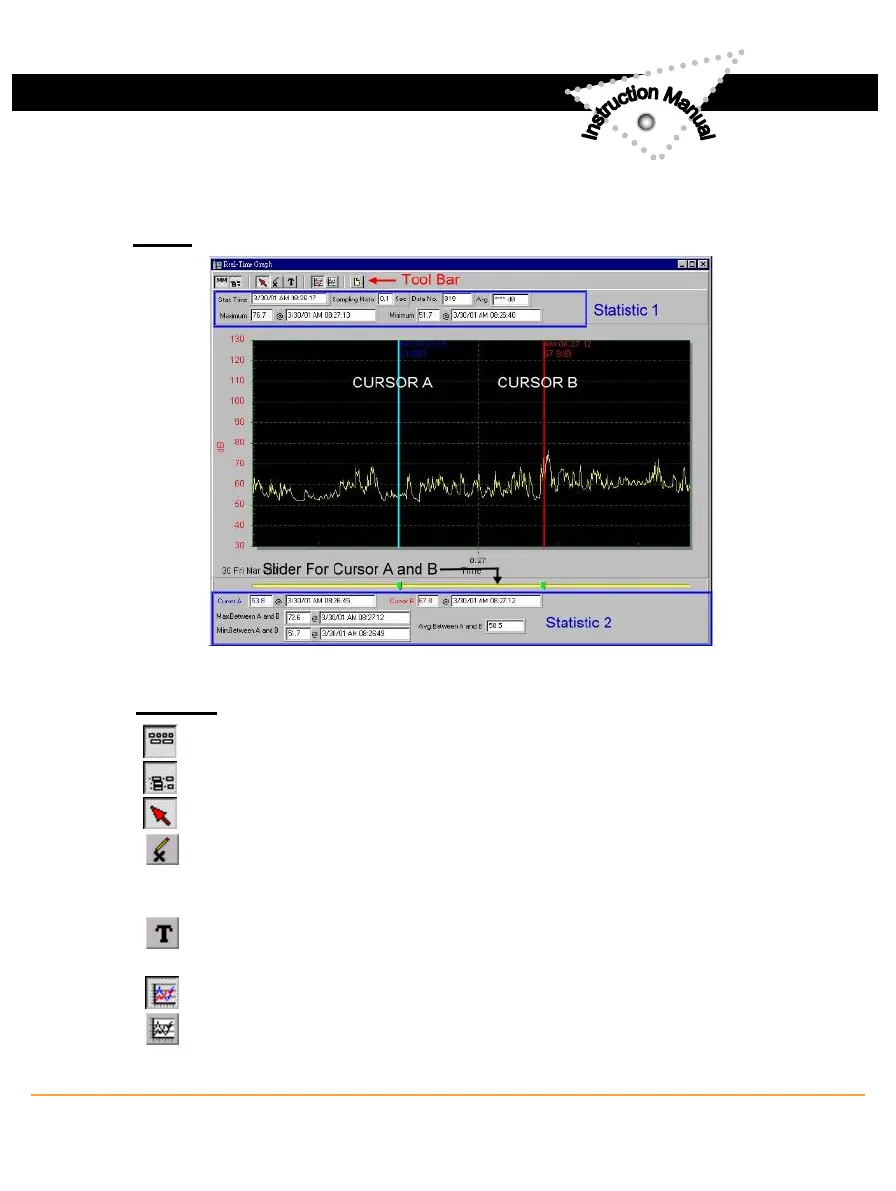
Graph
Tool Bar
- Display or hide Statistic1.
- Display or hide Statistic2.
- Normal cursor.
- When selected, the mouse cursor will become a cross sign when
moving to the graph, click on the graph to mark a cross sign on the
graph.
- When selected, the mouse cursor will become a "I" sign when
moving to the graph, click on the graph to annotate.
- Color graph.
- Monochrome graph.
2
www.SpectoTechnology.com
Specto Technology
y
1061 E. Elizabeth Ave. Linden, NJ 07036
y
866-925-7737
y
info@spectotechnology
11