DATALOGGER THERMOMETER
15
It will transfer first data set to graph on the right hand side. The user can also click at any
other data set to choose that set for graph.
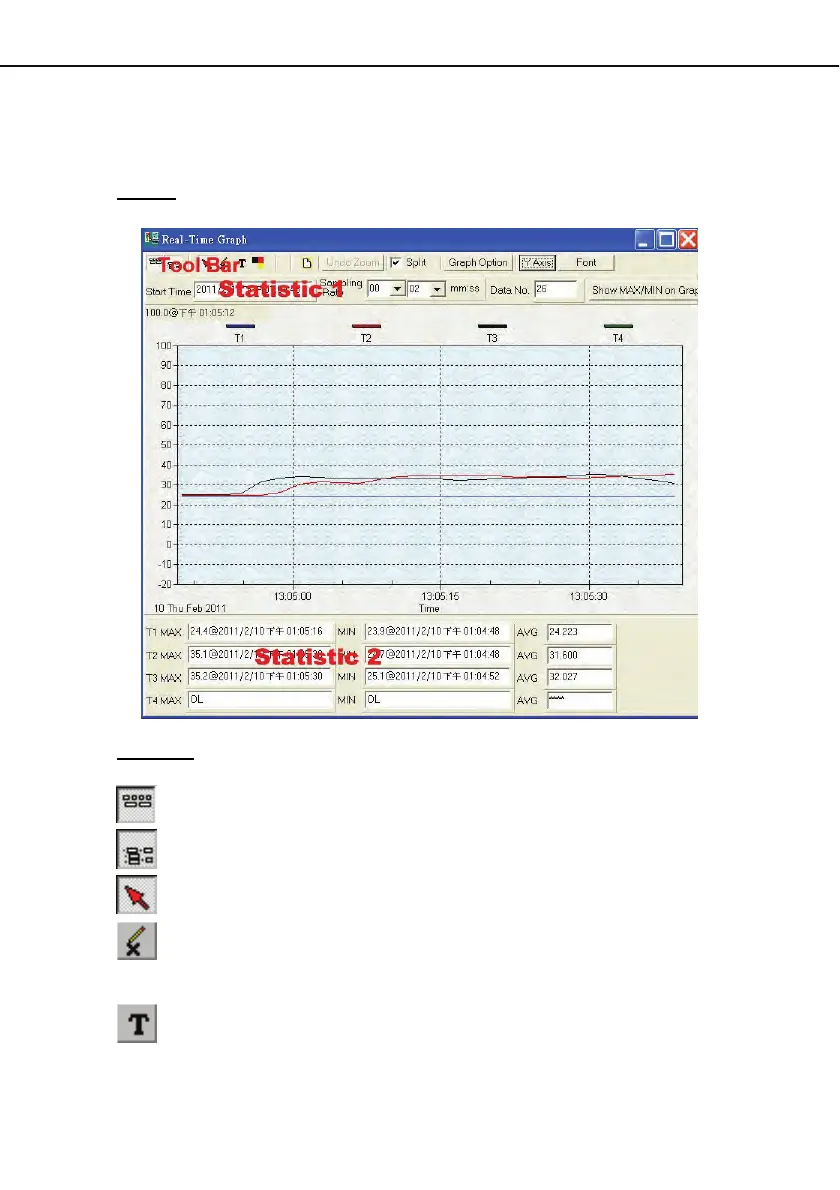
Graph:
Tool Bar:
- Display or hide Statistic1.
- Display or hide Statistic2.
- Normal cursor.
- When selected, the mouse cursor will become a cross sign when moving to the graph,
click on the graph to mark a cross sign on the graph. This is available only when "
Split " option is unchecked. And all the mark you make will exist with T1.
- When selected, the mouse cursor will become a " I " sign when moving to the graph,
click on the graph to annotate. This is available only when " Split " option is
unchecked. And all the text you make will exist with T1.